PalmLab Help Center
Search Function
Search for specific proteins and palmitoylation sites across the entire PalmLab database.
1 Search Interface
The search page provides multiple ways to find proteins:
Search Options:
- Search Box: Enter any search term
- Search Type:
- All Fields (default)
- UniProt ID
- Gene Symbol
- Protein Name
- Organism Filter:
- All Organisms
- Human only
- Mouse only
Input Examples:
Gene Symbols: SNAP23, KRAS, TP53, BRAF
Protein Names: "Synaptosomal-associated protein 23", "GTPase KRas"
Mixed Input: "O00161 SNAP23 KRAS"

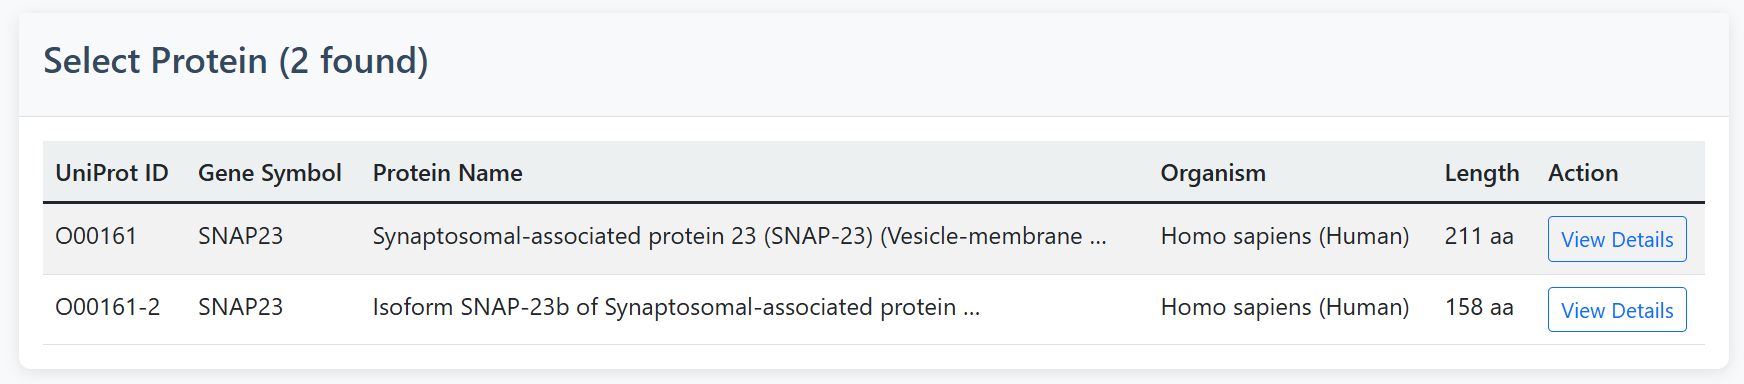
If the search yields multiple results, you can click "View Details" for the target protein in the table to examine it.
2 Search Results
After searching, you'll see a results table with the following information:
| Column | Description | Example |
|---|---|---|
| UniProt ID | Unique protein identifier | O00161 |
| Gene Symbol | Standard gene name | SNAP23 |
| Protein Name | Full protein description | Synaptosomal-associated protein 23 |
| Organism | Species information | Homo sapiens |
| Length | Protein length in amino acids | 211 aa |
| Action | Link to detailed view | "View Details" button |
3 Protein Details Page
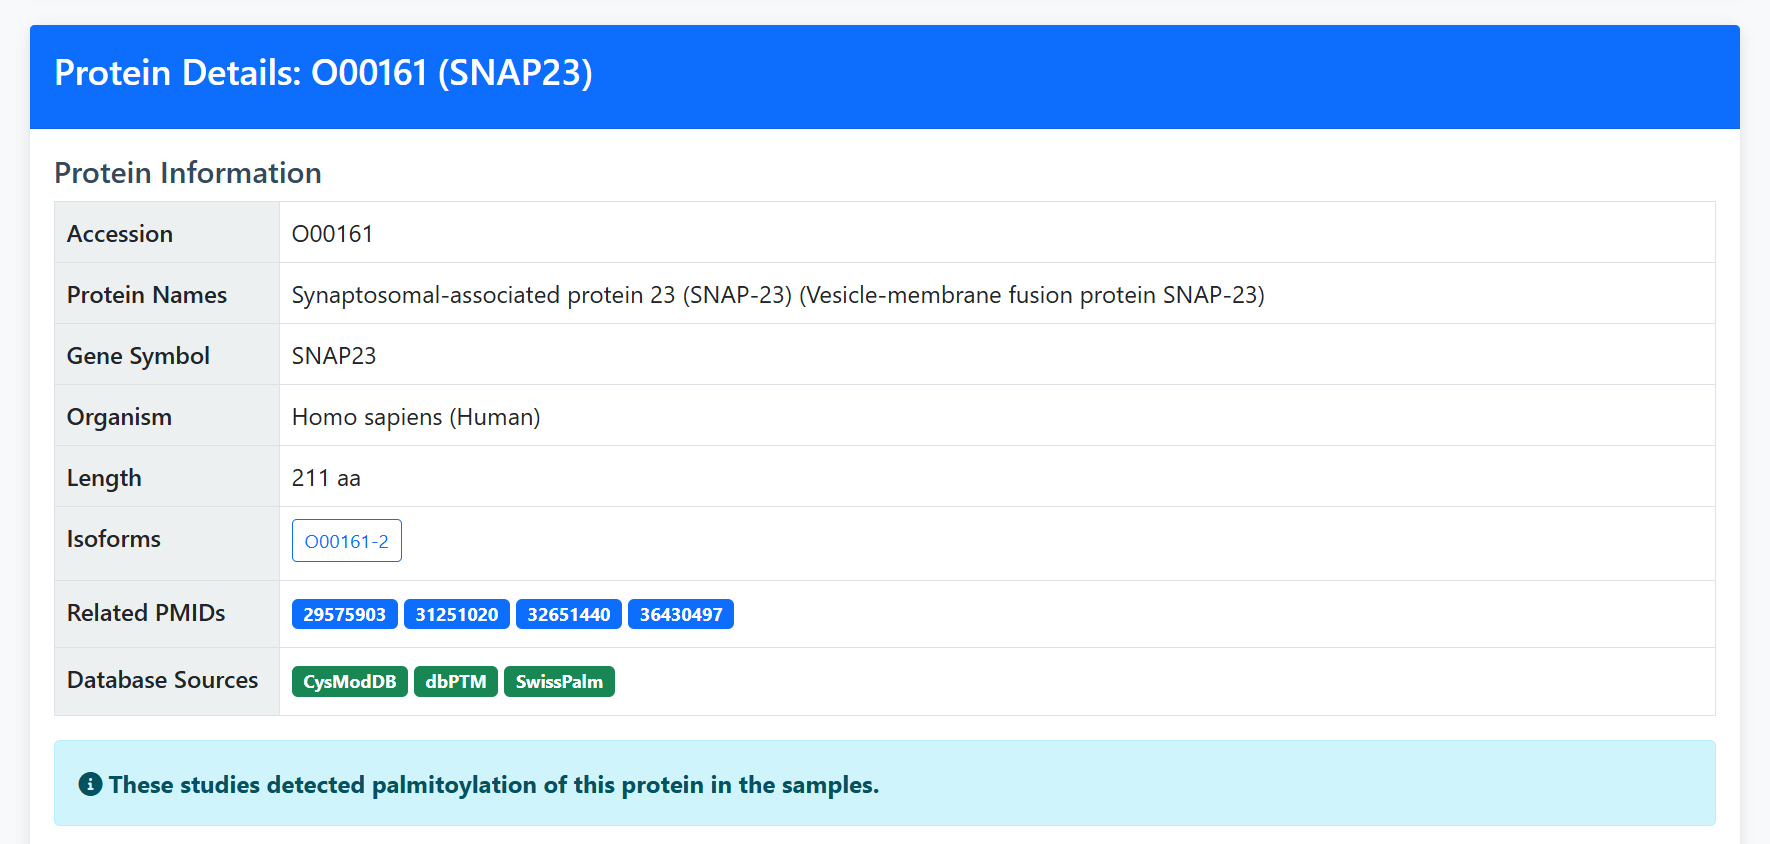
Click "View Details" to access comprehensive protein information:
Protein Information Section:
- Accession: UniProt identifier (e.g., O00161)
- Protein Names: Full descriptive name (e.g., Synaptosomal-associated protein 23)
- Gene Symbol: Standard gene name (e.g., SNAP23)
- Organism: Species information
- Length: Protein size in amino acids
- Isoforms: Alternative splice variants with canonical designation
- Related PMIDs: Links to relevant publications
- Database Sources: External databases with palmitoylation data (CysModDB, dbPTM, SwissPalm, PTMD)
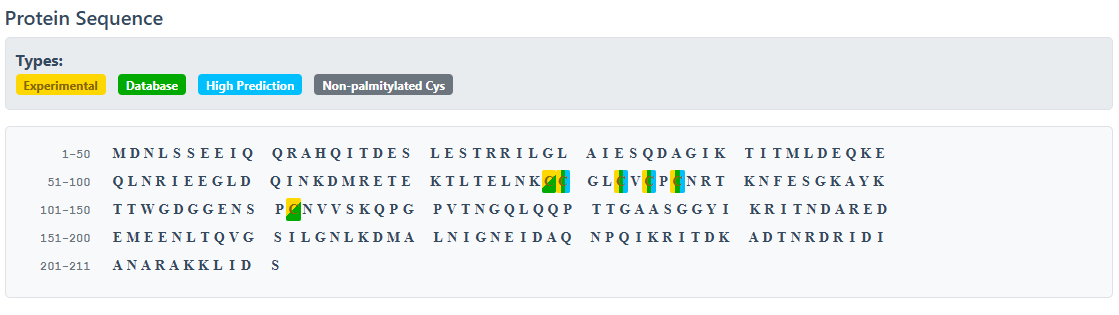
Protein Sequence with Site Annotation:
The sequence display uses color-coded highlighting to indicate different types of palmitoylation evidence:
Experimental Database High Prediction Non-palmitoylated Cys
Palmitoylation Sites Details:
Comprehensive table of all known palmitoylation sites with experimental sources:
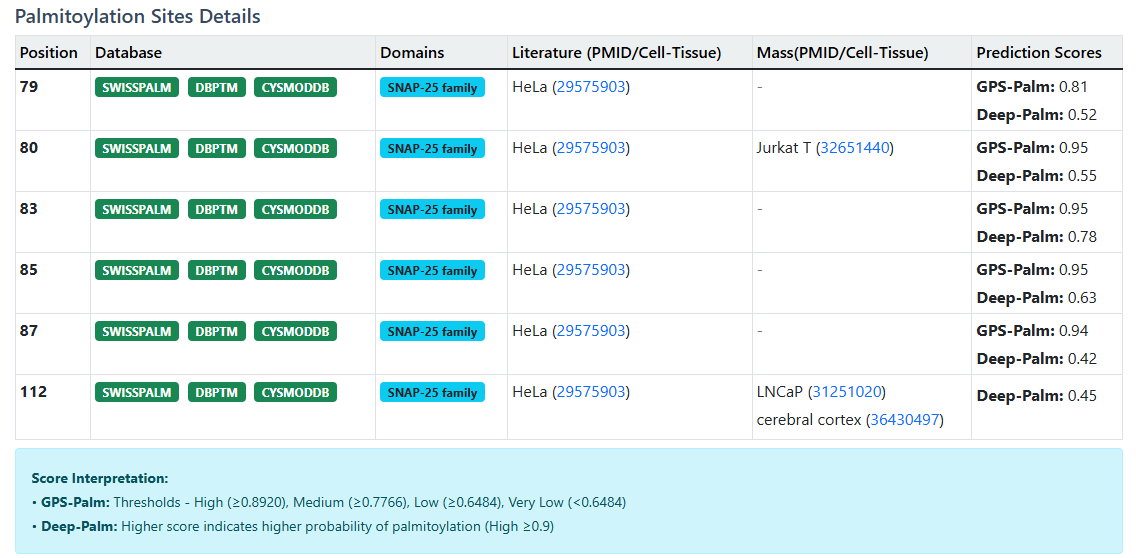
Note: The "Literature" column includes palmitoylation sites from published studies, while "Mass Spectrometry" column shows sites identified by re-analysis of mass spectrometry data. Both are considered experimental evidence.
Tissue/Cell Line Expression:
Visual representation of palmitoylation across different tissues and cell lines:
Literature Data - Tissue/Cell Line Expression
Bubble Heatmap: Shows the quantity and proportion of palmitoylated samples across tissues/cell lines from literature studies.
- Each bubble size represents the number of positive samples
- Color intensity indicates detection proportion
- TSI (Tissue Specificity Index): TSI = 0 (ubiquitous) to TSI = 1 (highly tissue-specific)
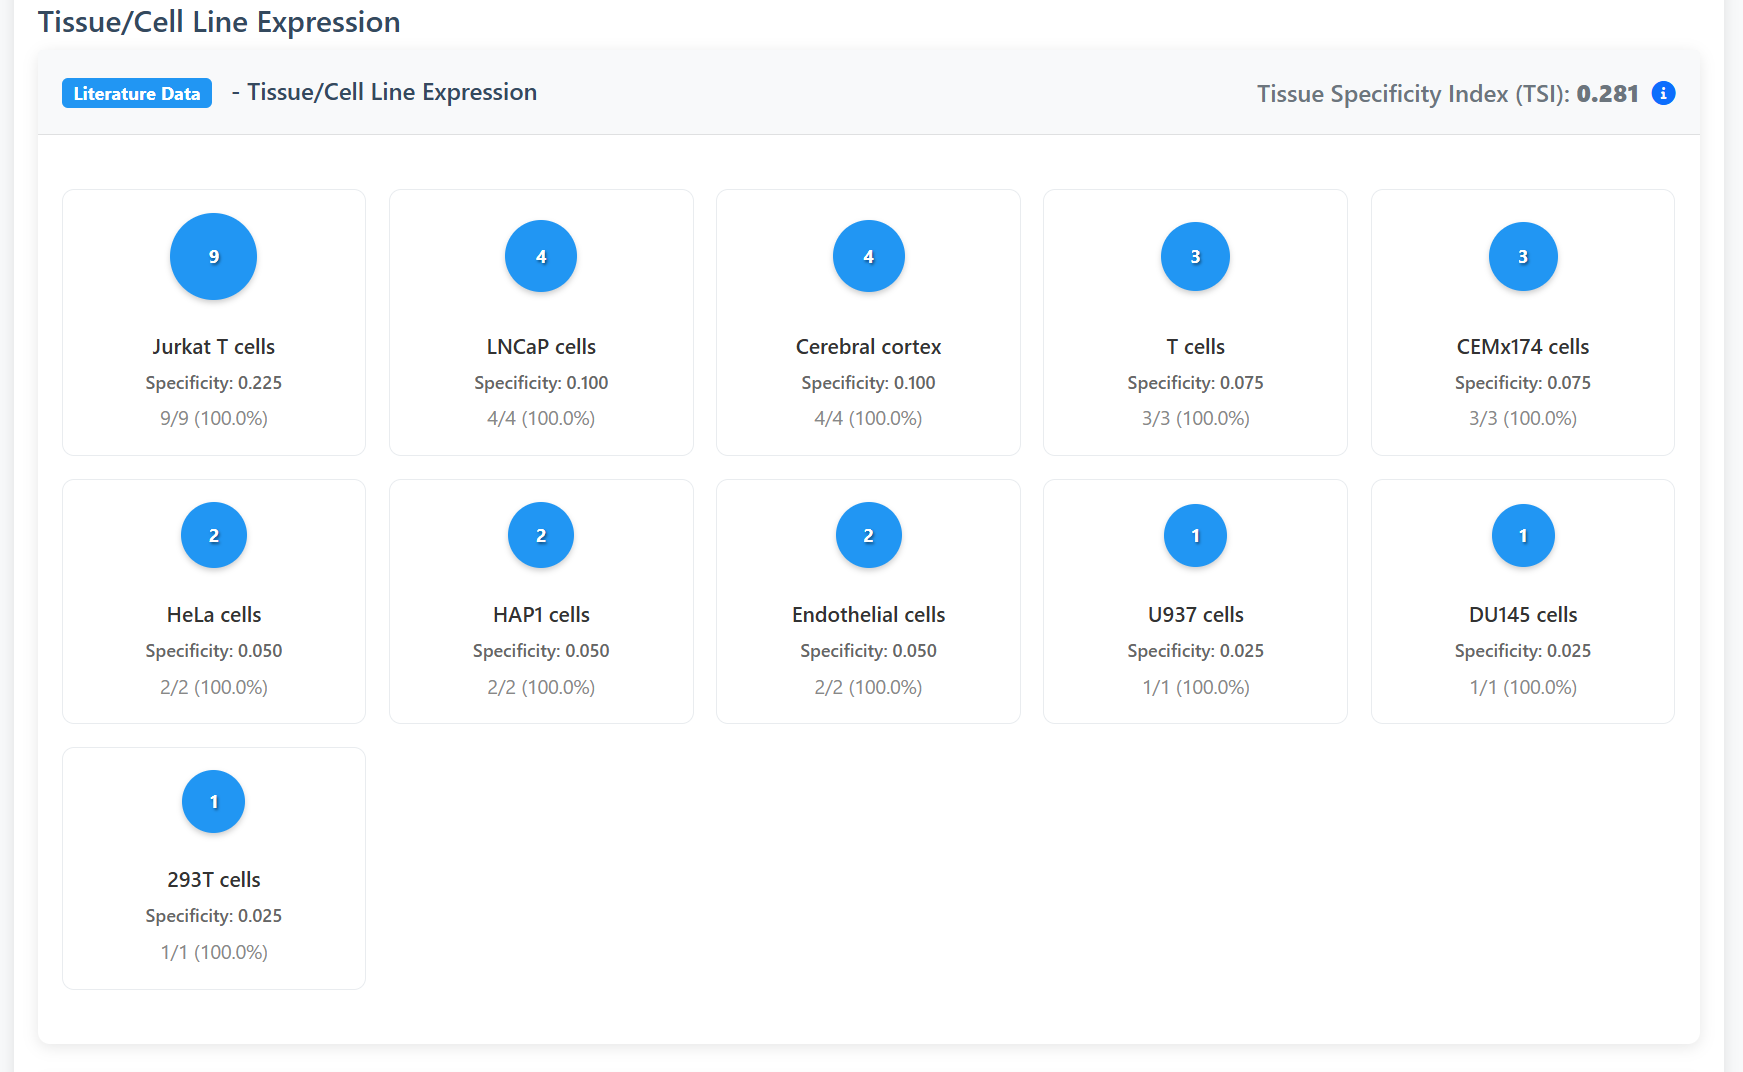
Example: O00161 shows detection in Jurkat T cells (9/9, 100%), LNCaP cells (4/4, 100%), cerebral cortex (4/4, 100%) with TSI = 0.281.
Mass Spectrometry Data - Tissue/Cell Line Expression
Bubble Heatmap: Shows palmitoylation detection from mass spectrometry studies across tissues and cell lines.
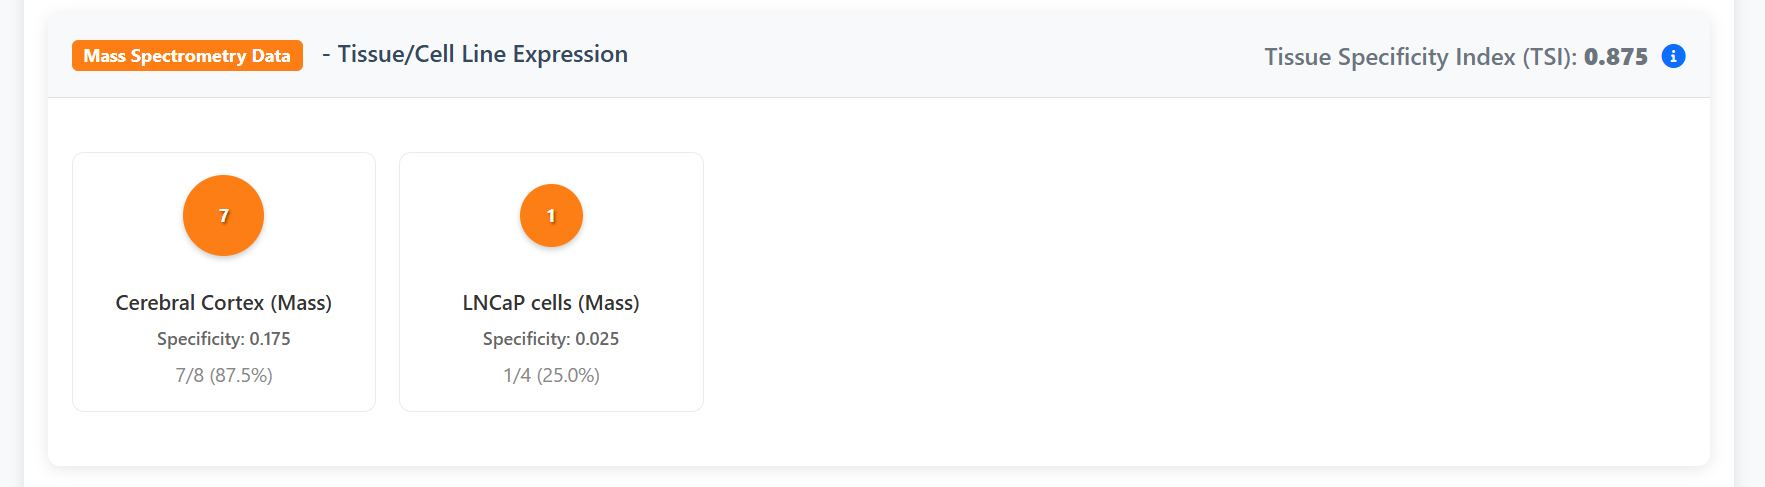
Example: O00161 shows cerebral cortex samples (7/8, 87.5%) and LNCaP cells (1/4, 25%) from mass spectrometry data with TSI = 0.875.
Palmitoylation Distribution by Study and Tissue/Cell Line
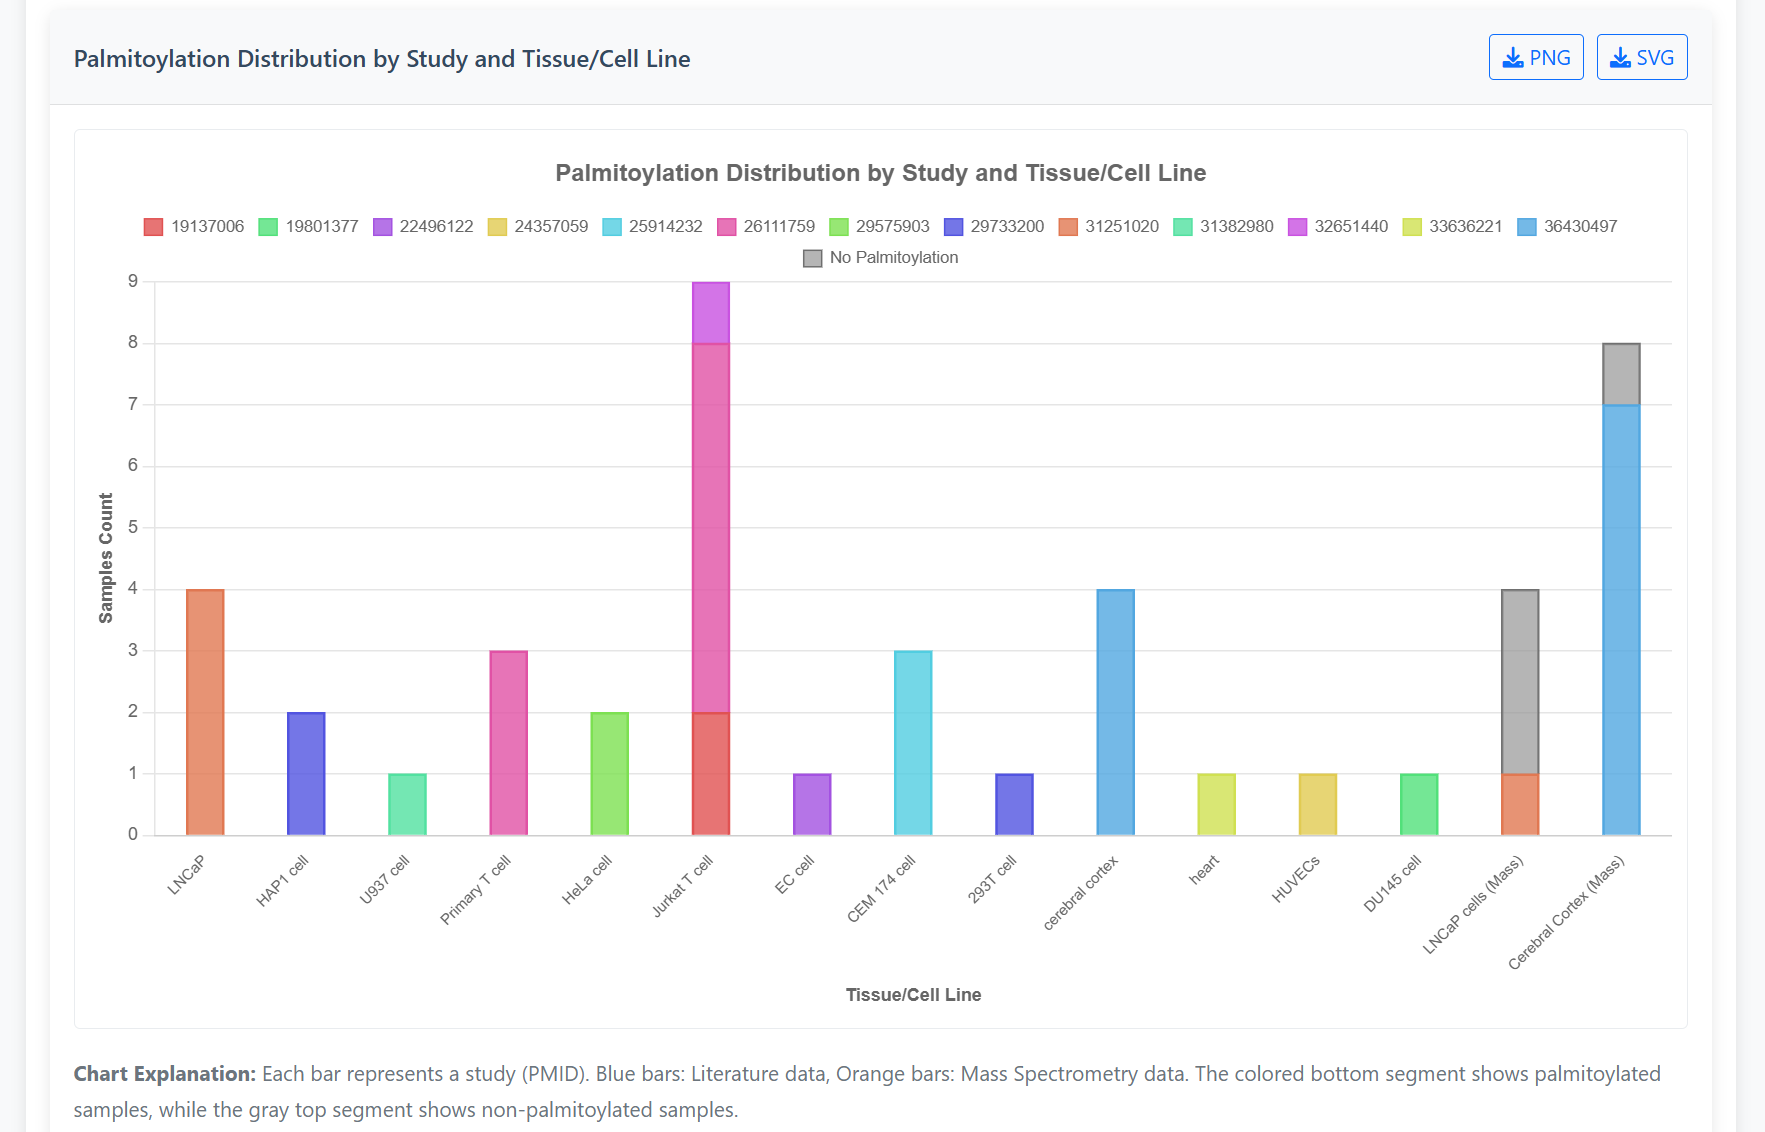
Stacked Bar Chart: Displays palmitoylation detection across different research studies (PMID).
- Blue bars = Literature data
- Orange bars = Mass Spectrometry data
- Colored bottom segment = Palmitoylated samples
- Gray top segment = Non-palmitoylated samples
PhyloP Conservation Scores:
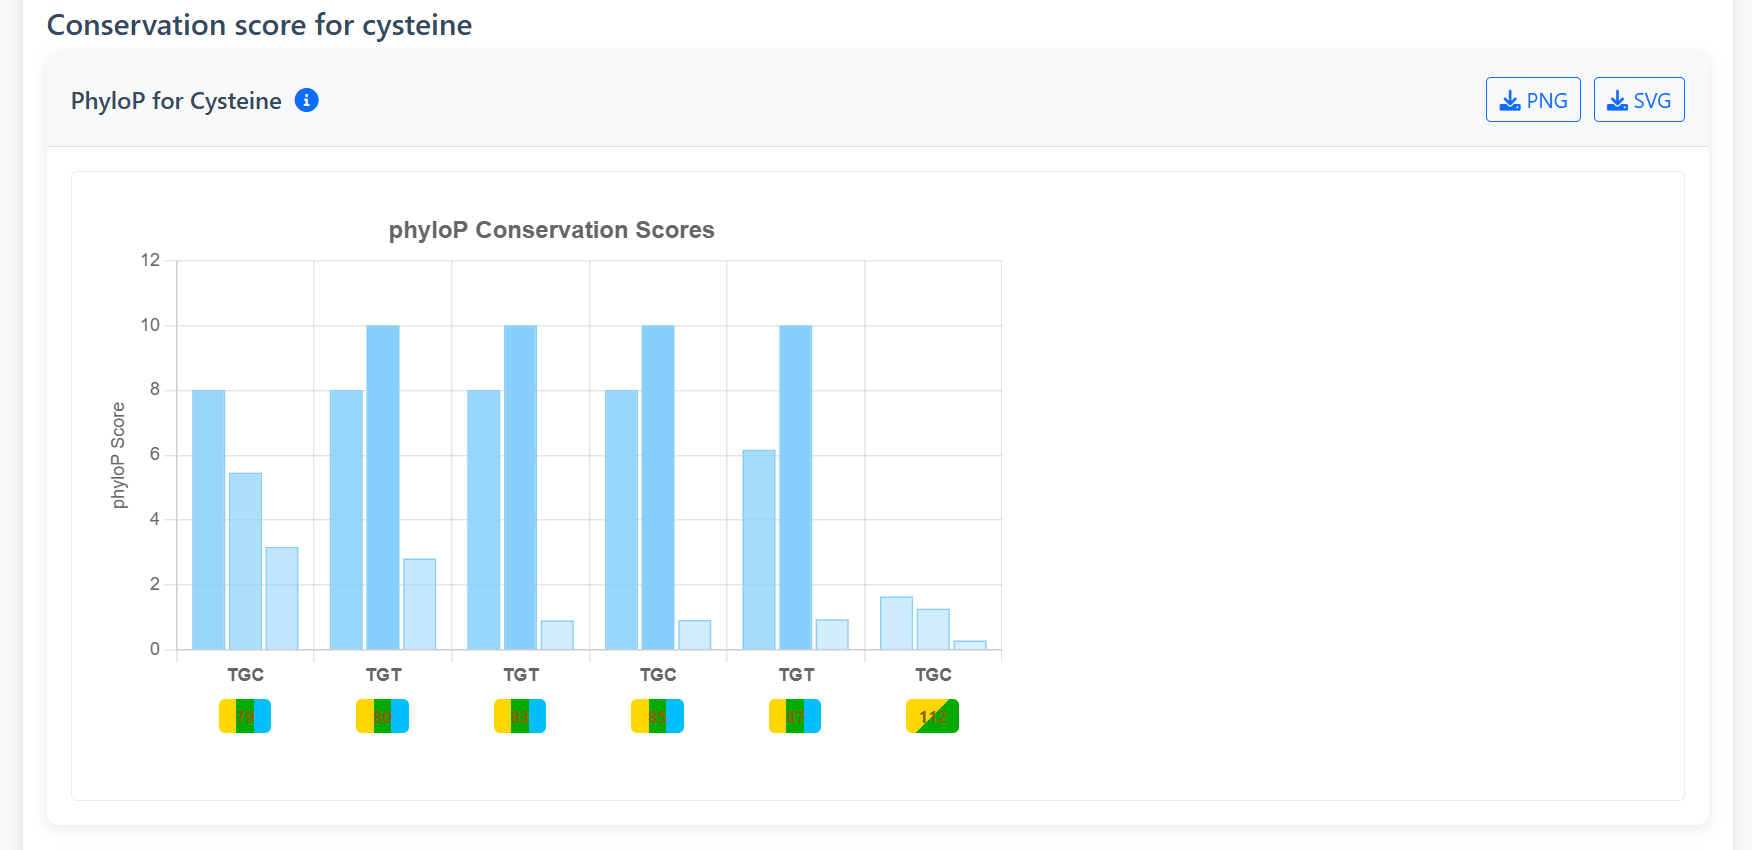
Measures evolutionary conservation at individual bases using phylogenetic p-values:
- Positive scores: Indicate conservation (higher = more conserved)
- Negative scores: Indicate accelerated evolution (lower = faster evolution)
- Near zero: Neutral evolution
- Color coding: Blue shades for conservation, pink shades for acceleration
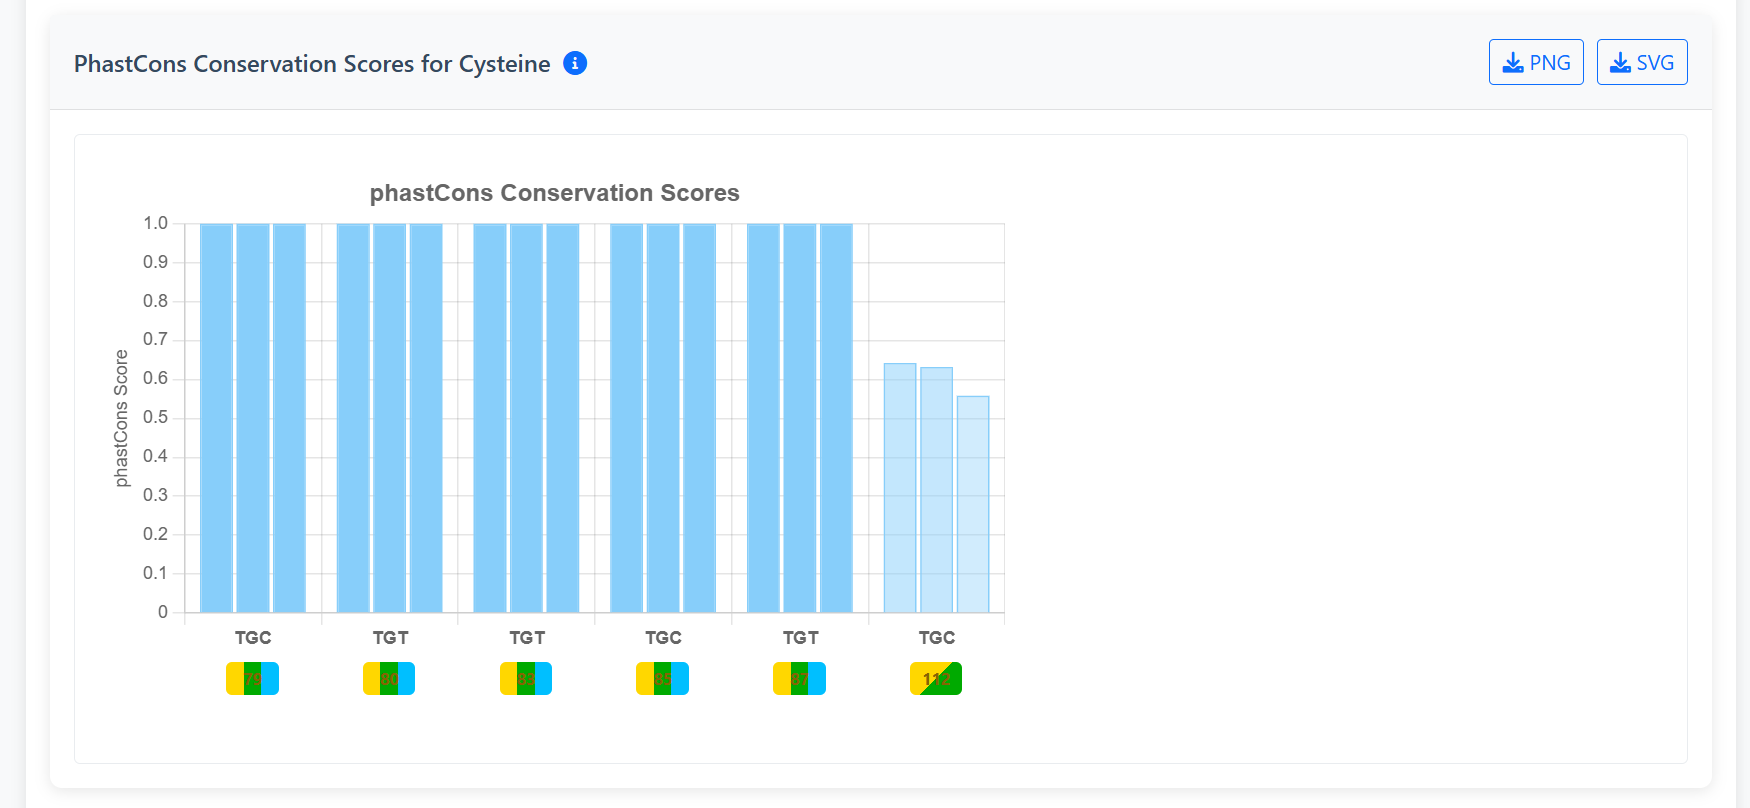
PhastCons Conservation Scores:
Identifies conserved elements using hidden Markov models:
- Range: 0 to 1
- Close to 1: Highly conserved, likely functional
- Close to 0: Fast evolving, less constrained
- Color coding: Blue shades for high conservation, pink shades for low conservation
Interpretation Guide:
Highly conserved modification sites (high positive phyloP, phastCons close to 1) may indicate functionally important modifications.
Rapidly evolving sites (negative phyloP) may represent species-specific adaptations.
Example O00161: Positions 79, 80, 83, 85, 87, 112 show conservation patterns that can be viewed in the interactive charts.
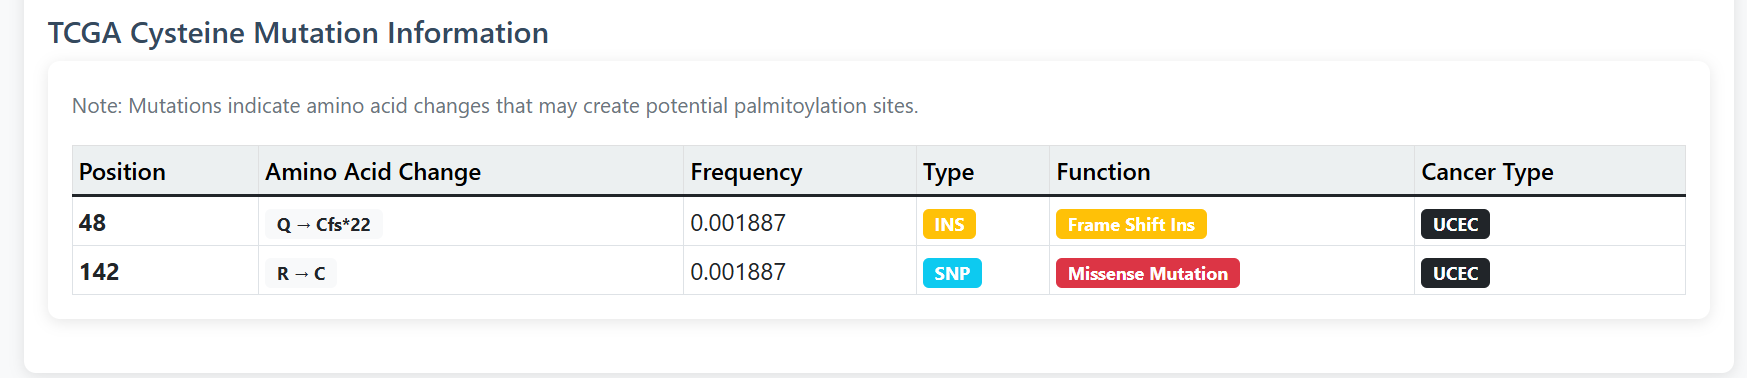
TCGA Mutation Information:
Cancer-related cysteine mutations that may create or affect palmitoylation sites:
- Mutation position and amino acid change (e.g., Q48Cfs*22, R142C)
- Frequency in cancer samples
- Mutation type (SNP, INS, DEL, etc.)
- Functional impact (Missense, Frame Shift, Nonsense, etc.)
- Associated cancer types (UCEC, BRCA, etc.)
Browse Database
Explore the PalmLab database through organized categories and filters.
1 By Database Source
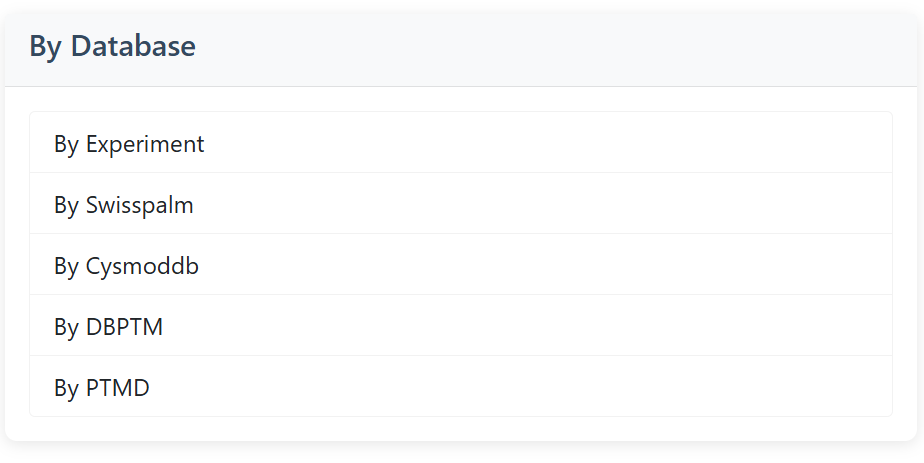
Browse palmitoylated proteins by data source (top 100 from experimental studies displayed; all from database sources shown):
Available Sources:
- By Experiment: Proteins with experimental validation
- By SwissPalm: Curated data from SwissPalm database
- By CysModDB: Cysteine modification database entries
- By dbPTM: Database of Post-Translational Modifications
- By PTMD: PTM database entries
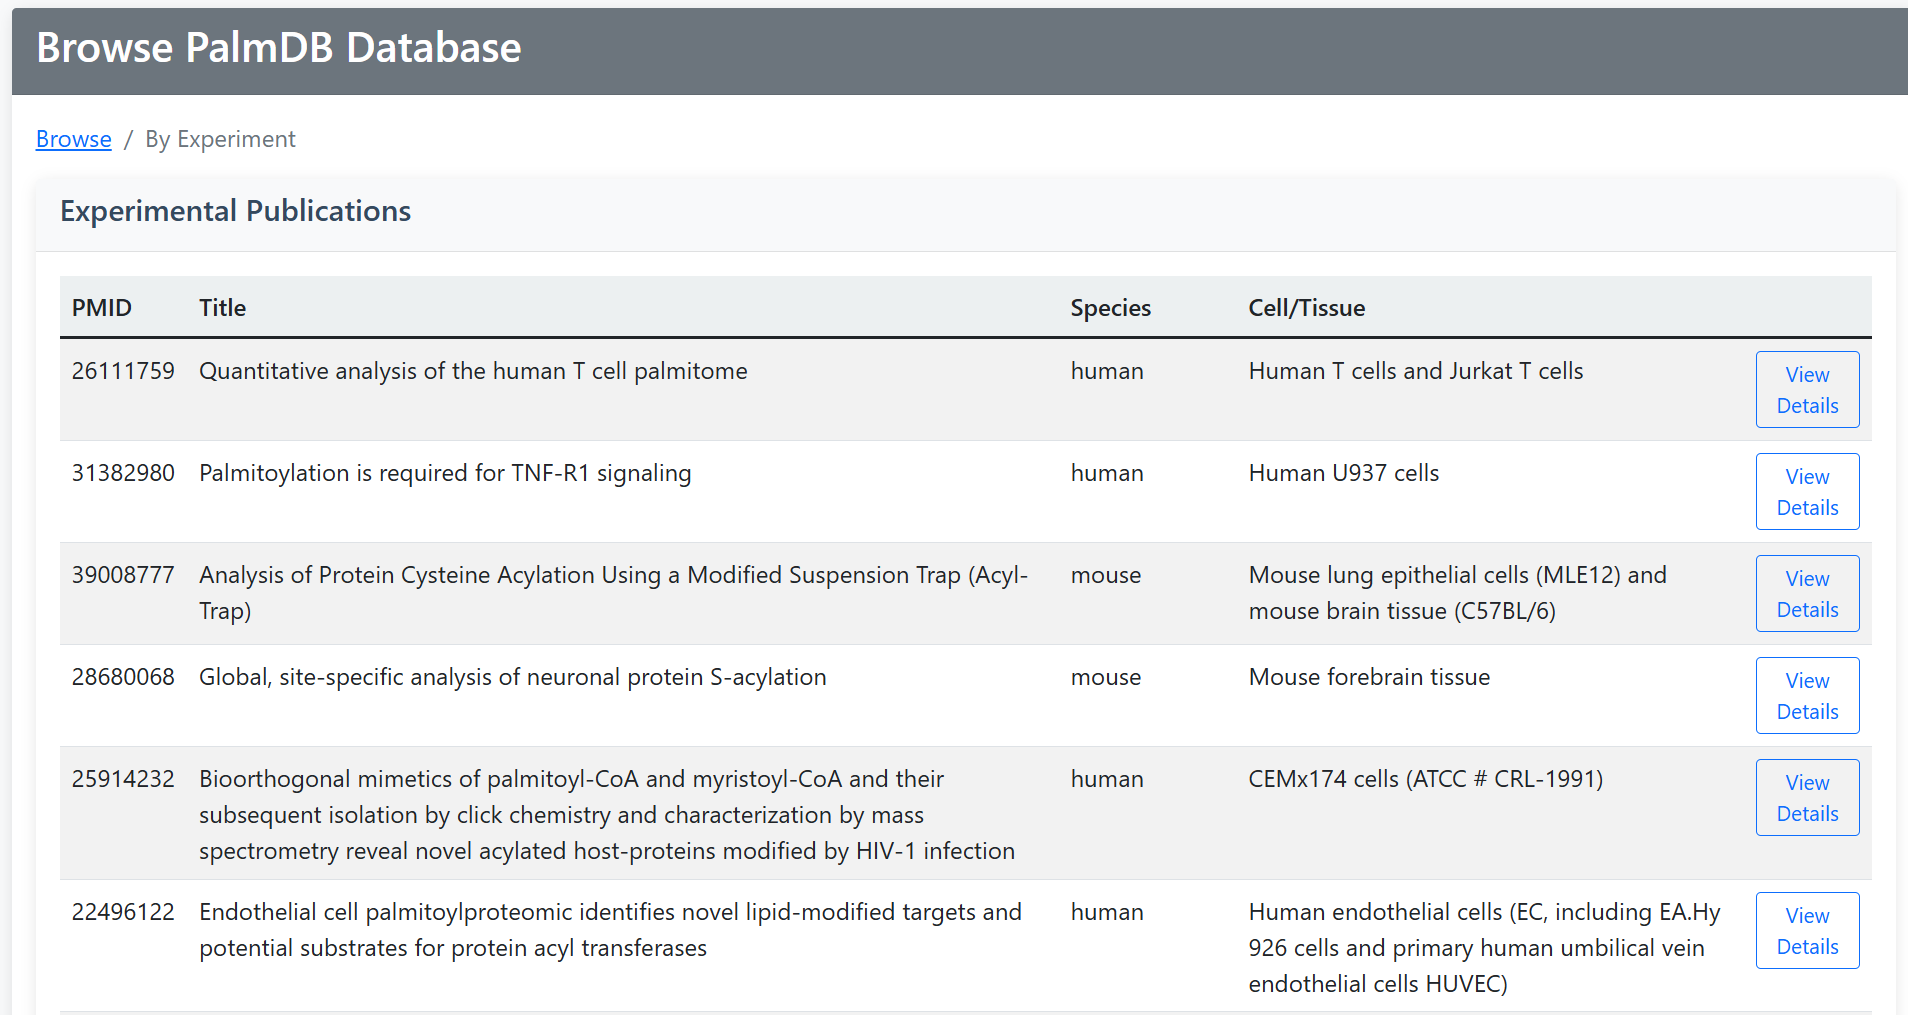
Example Output:
• PMID (Publication ID)
• Title
• Species
• Cell/Tissue
• Link to detailed view
2 By Organism
Top 100 Proteins Browse by species:
Available Organisms:
- Homo sapiens (Human): Complete human proteome
- Mus musculus (Mouse): Mouse protein data
- All Organisms: View across all species
Organism Statistics:
Mouse: ~15,000 proteins
Total: ~35,000 proteins
Palmitoylation Sites: ~50,000 total
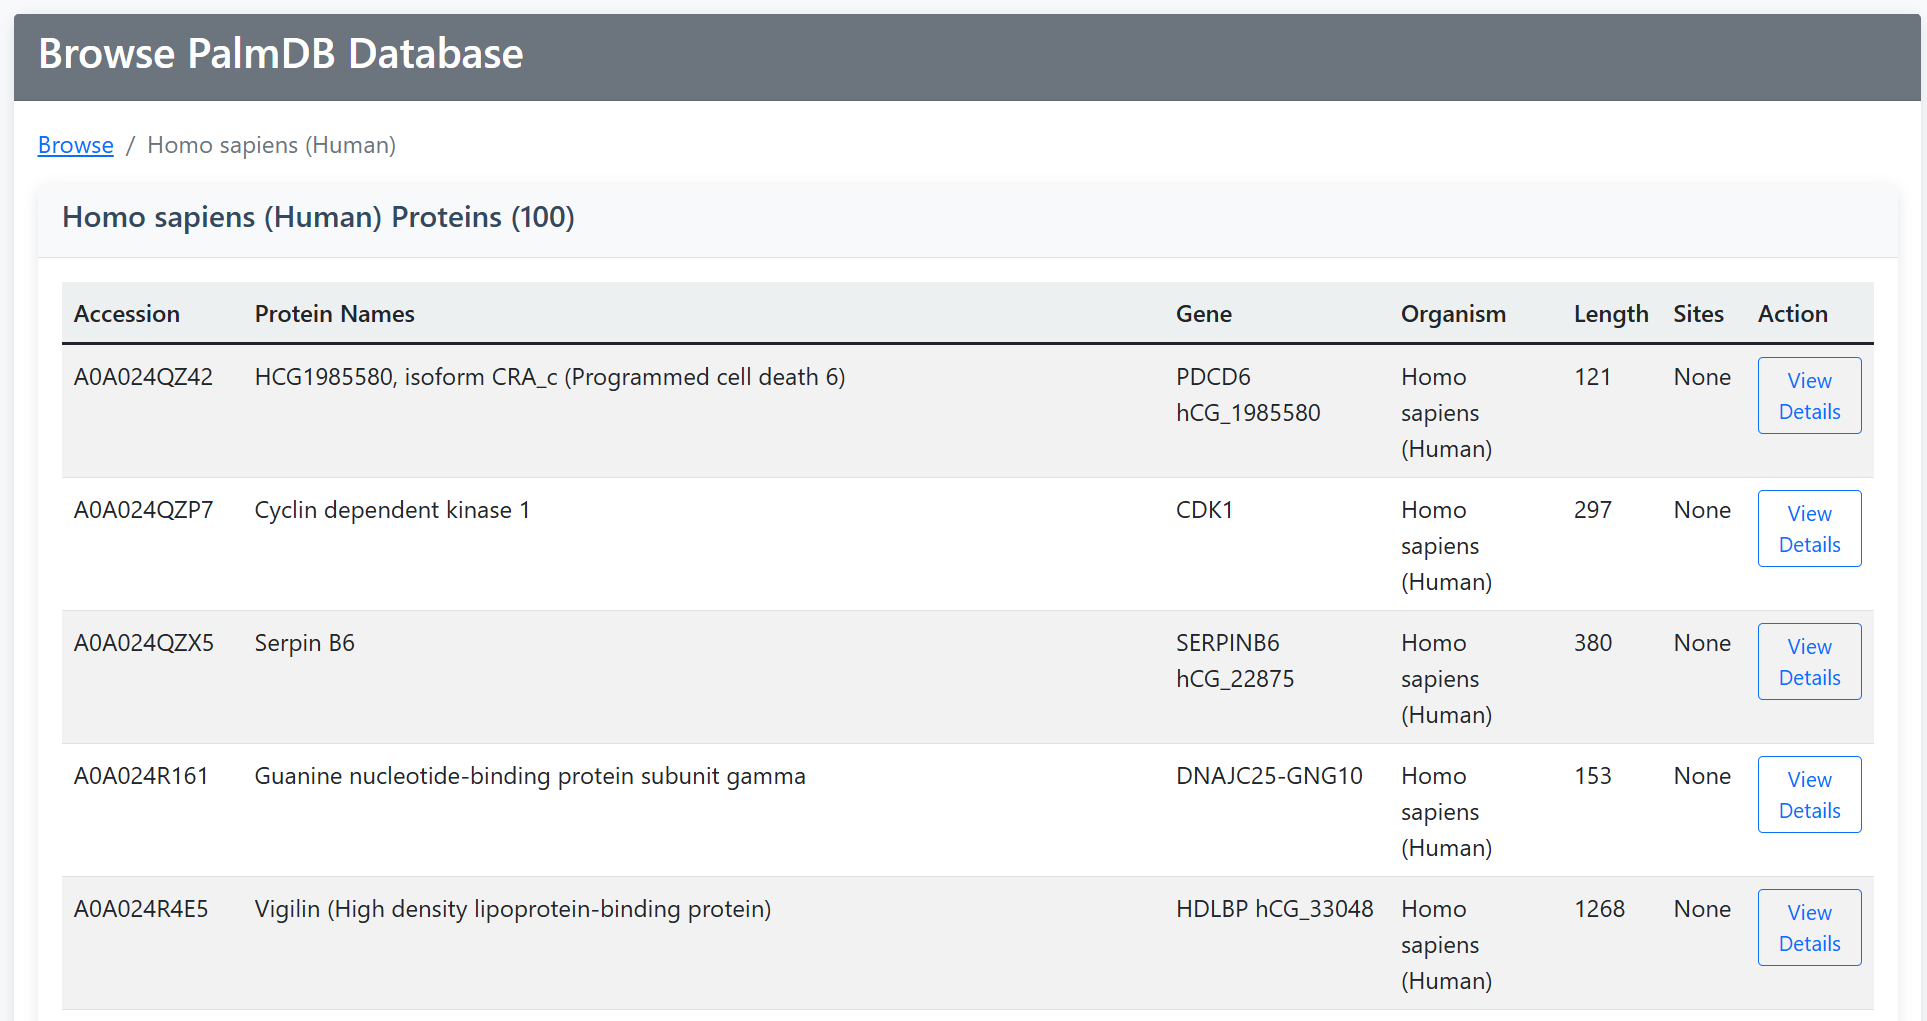
4 Browse Results
All browse views provide consistent protein information:
| Information | Description |
|---|---|
| Accession | UniProt identifier with link to details |
| Protein Names | Descriptive protein name |
| Gene | Gene symbol |
| Organism | Species information |
| Length | Protein size in amino acids |
| Sites | Number of palmitoylation sites |
| Action | "View Details" link to full protein page |
Tool 1: Differential Palmitoylation Analysis
Compare the palmitoylation status of query protein across different samples.
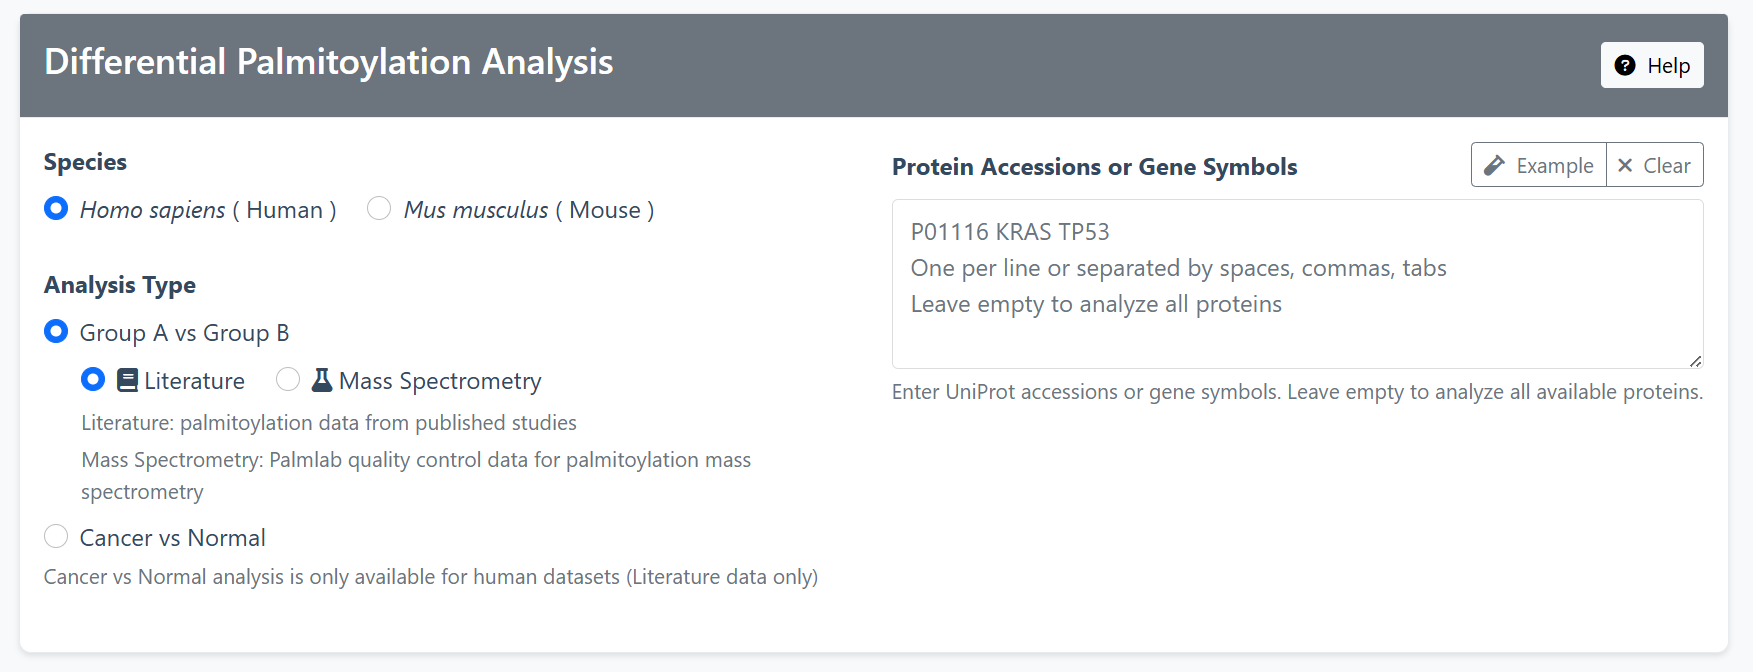
1 Configuration Setup
Species Selection: Choose between Human or Mouse data
Analysis Type:
- Group A vs Group B: Compare any two groups of datasets
- Cancer vs Normal: Specifically compare cancer vs normal tissues (Human only, Literature data only)
Data Source:
- Literature: Palmitoylation data from published studies
- Mass Spectrometry: PalmLab quality control data for palmitoylation mass spectrometry
Protein Input: Enter UniProt accessions or gene symbols (e.g., P01116, KRAS, TP53)
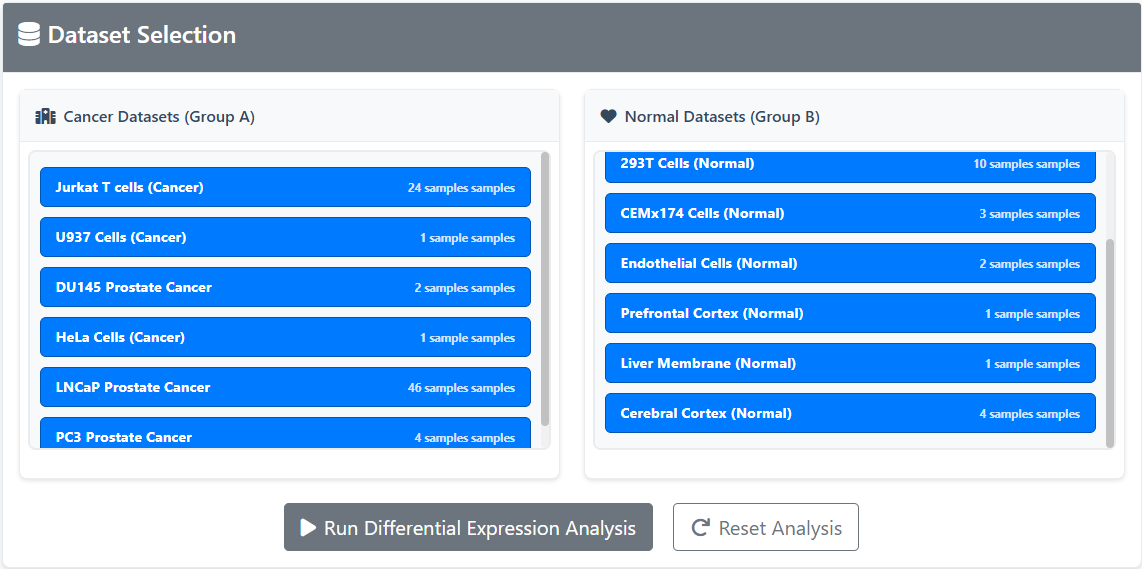
2 Dataset Selection
Available Datasets:
- Group A vs Group B: Compare any two groups of datasets
- Cancer vs Normal: Specifically compare cancer vs normal tissues (Human only)
3 Protein Validation
The system automatically validates input proteins and provides feedback:
- Not Found - Protein or gene not in database
- Species Mismatch - Protein or gene exists but in different species
- Insufficient Data - Protein or gene has insufficient samples in selected datasets. Please select more datasets.
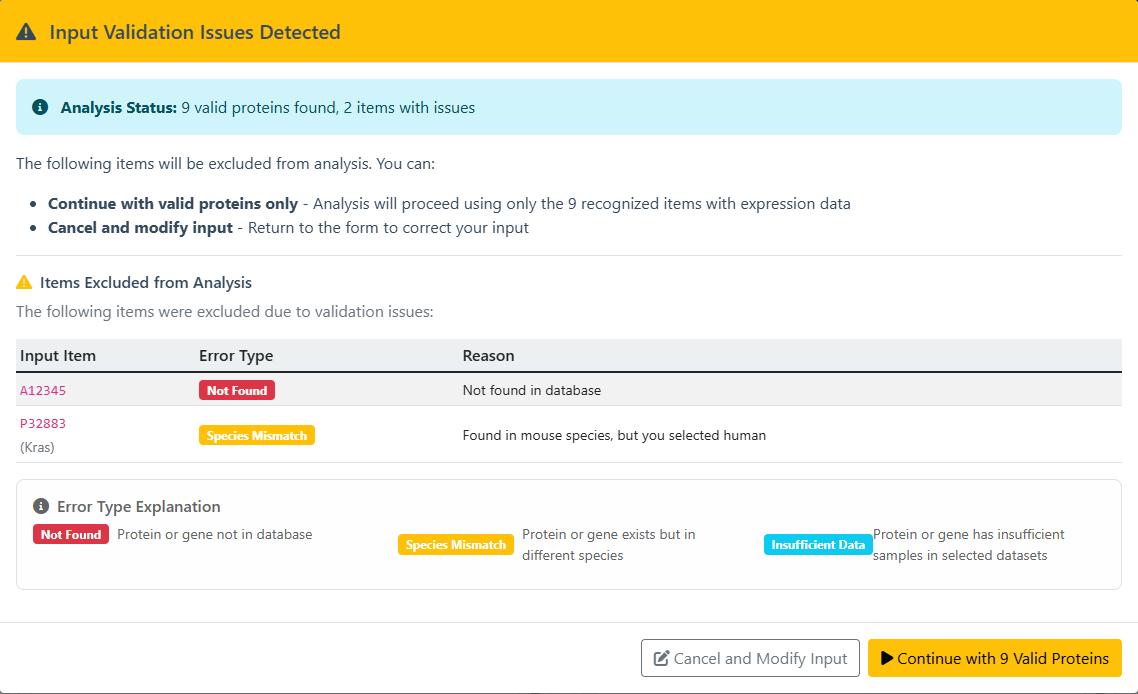
- Continue : Ignore these errors and proceed with analyzing the correct protein or gene.
- Cancel and Modify Input : Return to the previous step to make adjustments.
4 Analysis Execution
Click "Run Differential Expression Analysis" to start the analysis process.
5 Results Interpretation
The results page provides:
- Summary Statistics: Overview of analyzed proteins and significant findings
- Results Table: Detailed comparison for each protein including:
- Protein accession and gene symbol
- Expression ratios for both groups
- Odds ratio and p-value
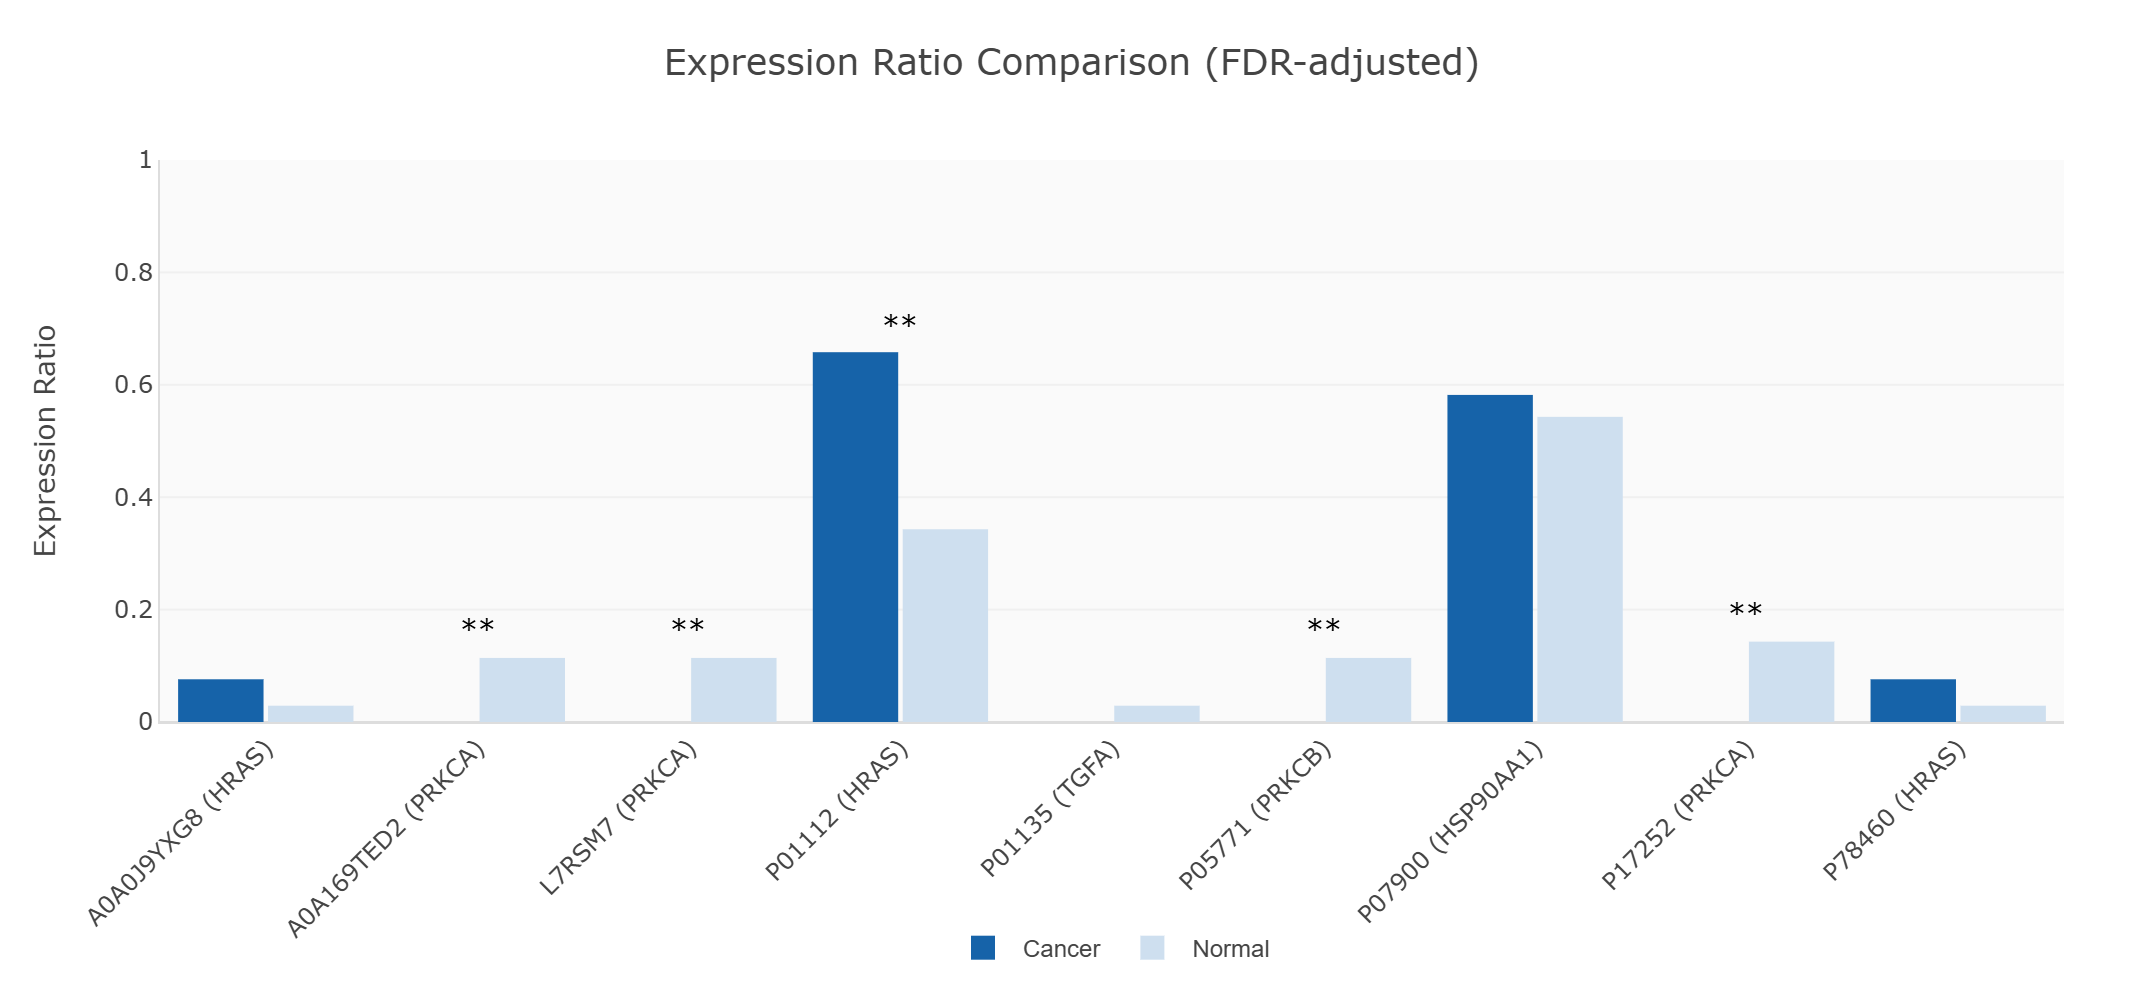
- Significance indicators (*p<0.05, **p<0.01, ***p<0.001)
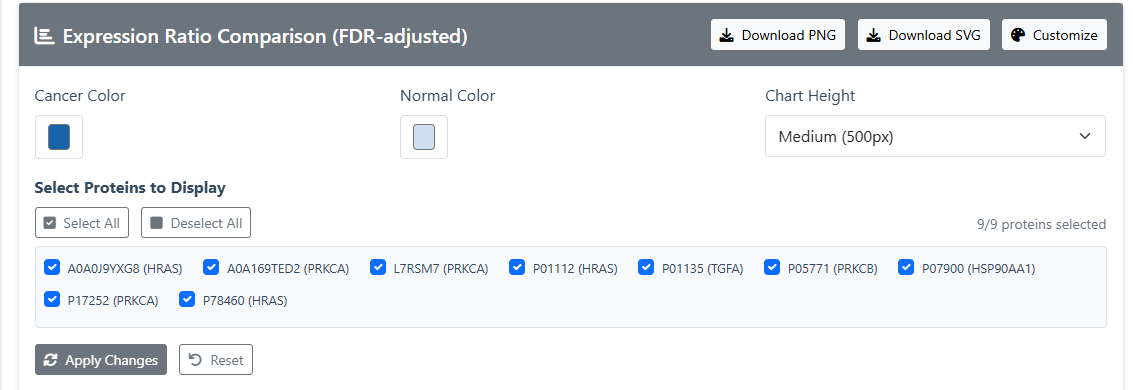
- Visualization: Interactive bar chart comparing expression ratios:
- Click "Customize"
- Customizable colors and selectable visual proteins
- Click “Apply Changes” to visualize.
- Visual images can be downloaded and saved by clicking “Download png” or “Download SVG”.

Tool 2: Palm-Protein Network Analysis
Find exclusive or co-occurrent palmitoylation partners of a query protein, with network visualization and statistical metrics.
1 Input Configuration
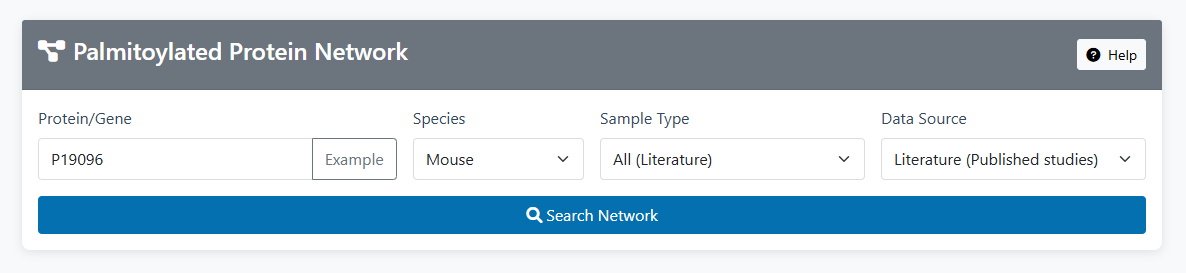
Enter Query Protein: UniProt accession (e.g., P12345) or gene symbol (e.g., TP53)
Choose Species: Human or Mouse
Select Tissue/Sample Type:
- Mouse: All
- Human: All, Tumor, Normal (only for Literature data)
Data Source: Literature (published studies) or Mass Spectrometry
2 Analysis Execution
Click "Search Network" to retrieve statistically significant partners and generate an interactive network.
3 Results Interpretation
Results Table
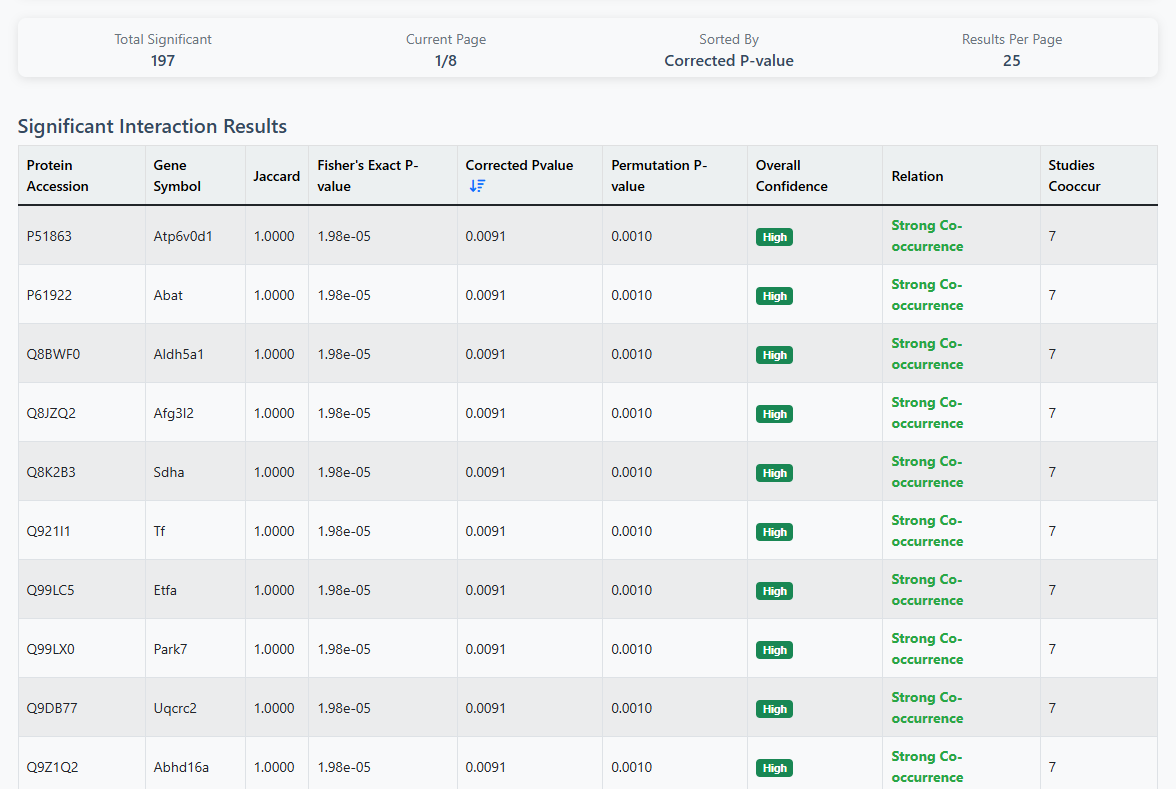
- Displays up to significant interactions (paginated, 25 per page)
- Columns: Protein Accession, Gene Symbol, Jaccard, Fisher's Exact P-value, Corrected P-value, Permutation P-value, Overall Confidence, Relation, Studies Cooccur
- Sortable by Corrected P-value, or Jaccard
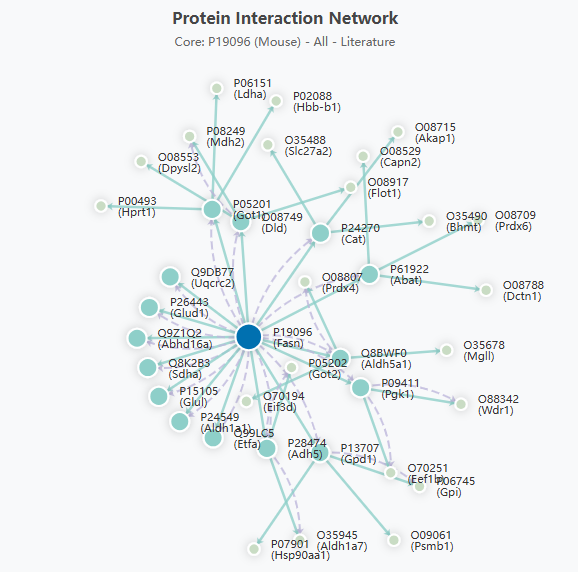
Network Visualization
- ● Core Protein (query)
- ● 1st Level - Co-occurrence
- ● 1st Level - Mutual Exclusion
- ● 2nd Level - Co-occurrence
- ● 2nd Level - Mutual Exclusion
- ● Independent (grey)
Relationship & Confidence Criteria
- Co-occurrence: FDR < 0.05, OR > 1. Strength: Strong (Jaccard ≥ 0.6), Moderate (0.3–0.6), Weak (<0.3)
- Mutual-exclusion: FDR < 0.05, OR < 1 (no intensity subdivision)
- Independent: FDR ≥ 0.05 or OR = 1
- Confidence: High (FDR < 0.01), Medium (FDR < 0.05)
4 Interactive Features
- Drag nodes to rearrange the layout
- Hover to see protein details and metrics
- Scroll to zoom in/out
- Download the network as SVG for publications
Tool 3: Protein Relationship Analysis
Analyze the mutual exclusion or co-occurrence relationship between two specific proteins across samples, with comprehensive statistics and heatmap visualization.
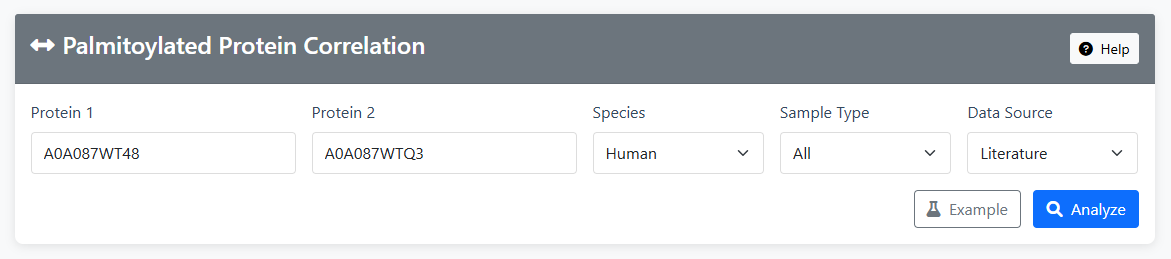
1 Input Configuration
Two Proteins: Enter UniProt accessions or gene symbols (e.g., P01116, KRAS)
Species: Human or Mouse
Tissue/Sample Type:
- Mouse: All
- Human: All, Tumor, Normal (Literature only)
Data Source: Literature or Mass Spectrometry
2 Analysis Execution
Click "Analyze Relationship" to run the statistical test and generate heatmap.
3 Results Interpretation
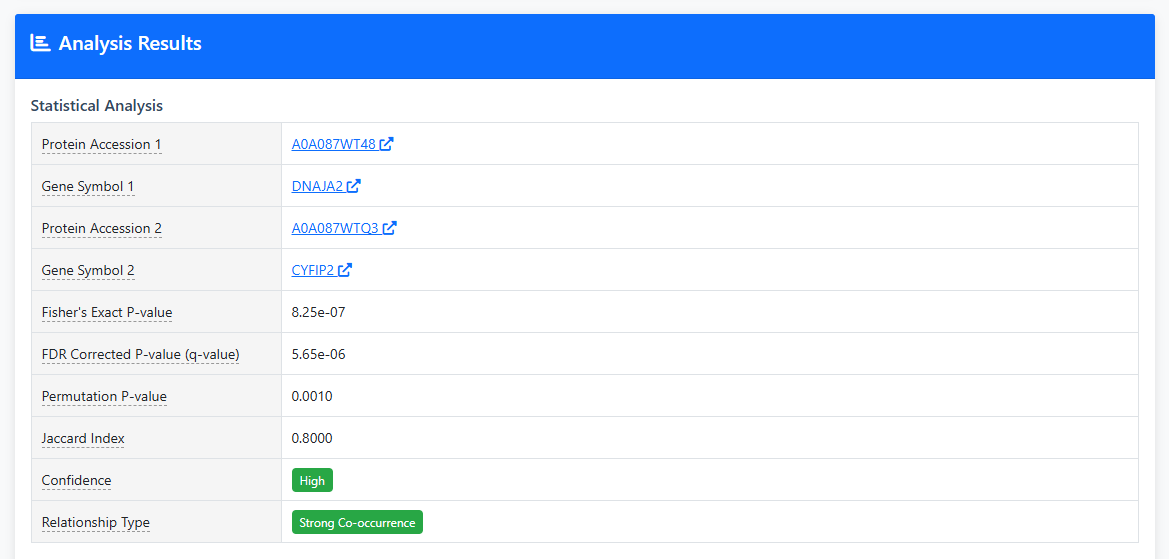
Statistical Results Table
- Displays protein identifiers, Fisher's exact P-value, FDR, Permutation P-value, Jaccard index, Confidence, and Relationship Type.
- Confidence: High (FDR < 0.01), Medium (FDR < 0.05).
- Relationship Type:
- Co-occurrence: FDR < 0.05, OR > 1. Subdivided into Strong (Jaccard ≥ 0.6), Moderate (0.3–0.6), Weak (<0.3).
- Mutual-exclusion: FDR < 0.05, OR < 1.
- Independent: FDR ≥ 0.05 or OR = 1.
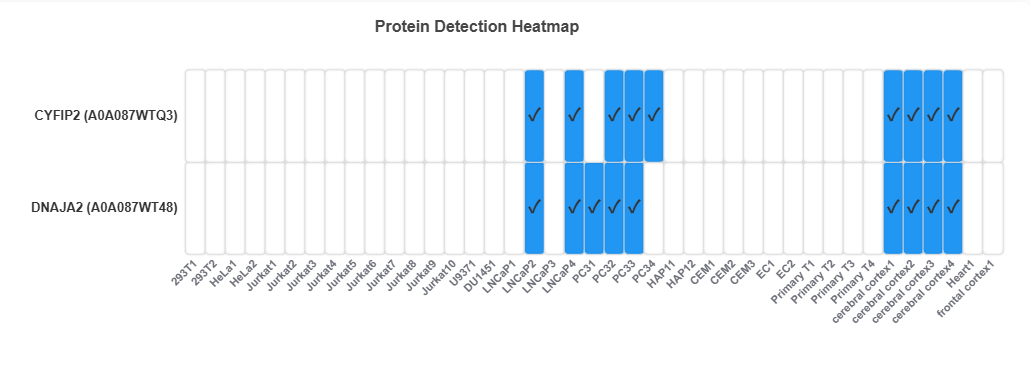
Heatmap Visualization
- Binary matrix: White = not detected (0), Blue = detected (1).
- Samples sorted by tissue type; X‑axis labels colored by tissue.
- Download as PNG or SVG.
4 Interpretation Guide
Statistical Significance
- FDR < 0.05: Statistically significant relationship.
- OR > 1: Positive association (co‑occurrence).
- OR < 1: Negative association (mutual exclusion).
- Jaccard near 1: High co‑detection similarity.
Biological Interpretation
- Co-occurrence: May indicate functional cooperation, same pathway, or complex formation.
- Mutual Exclusion: May indicate functional redundancy, distinct cellular states, or compensatory mechanisms.
- Tissue-specific patterns: Reveal context-dependent relationships.
Tool 4: Hotspot Mutation Analysis
Analyze the relationship between palmitoylation proteins and tumor hotspot mutations (CNVs/SNVs/genes) in human cell lines.
🔍 Search Modes
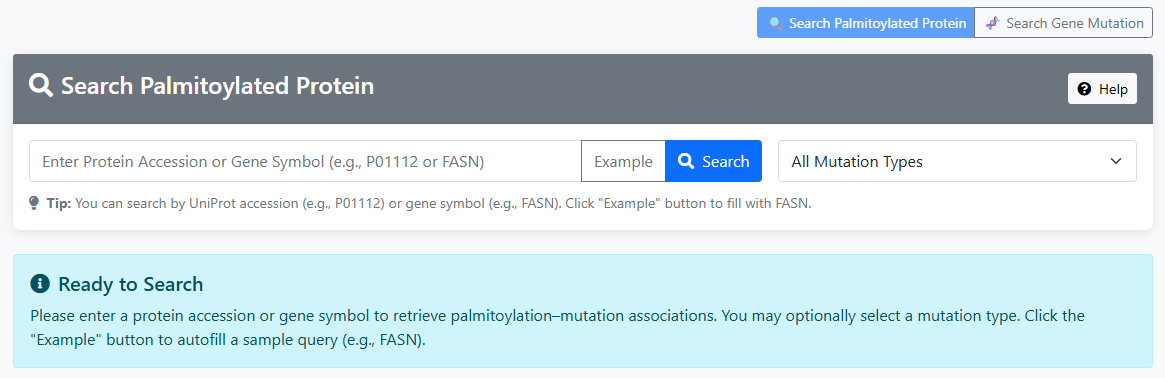
Protein Search
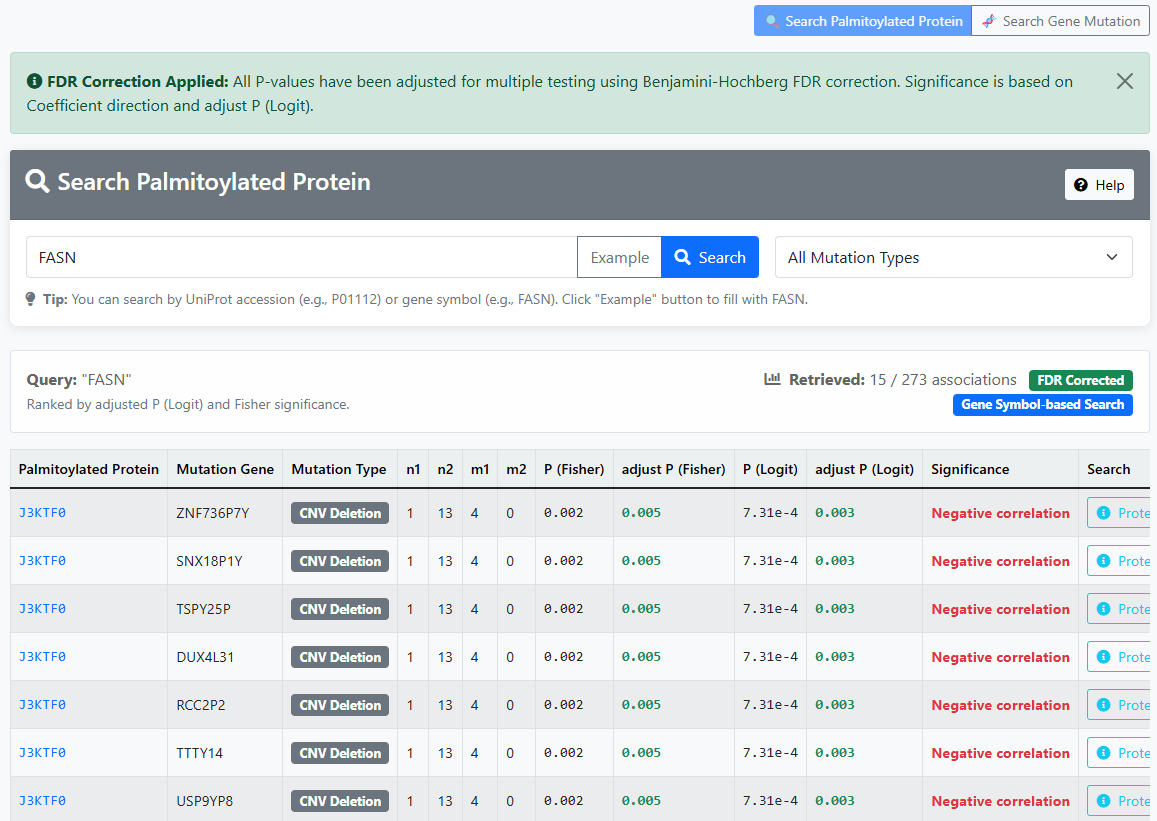
- Input: Enter Protein Accession or Gene Symbol (e.g., P01112 or FASN)
- Function: Search mutation information for specific proteins
- Output: All mutations associated with the protein
- Display Columns: Gene Symbol, Mutation Gene, Mutation Type
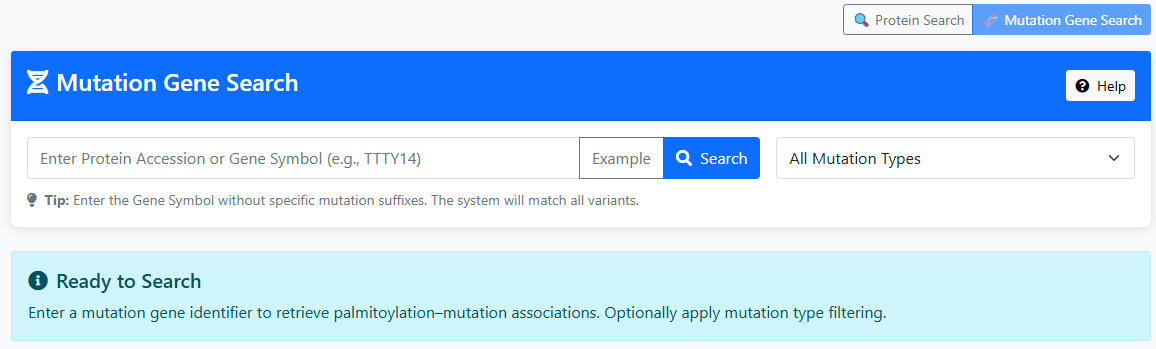
Mutation Gene Search
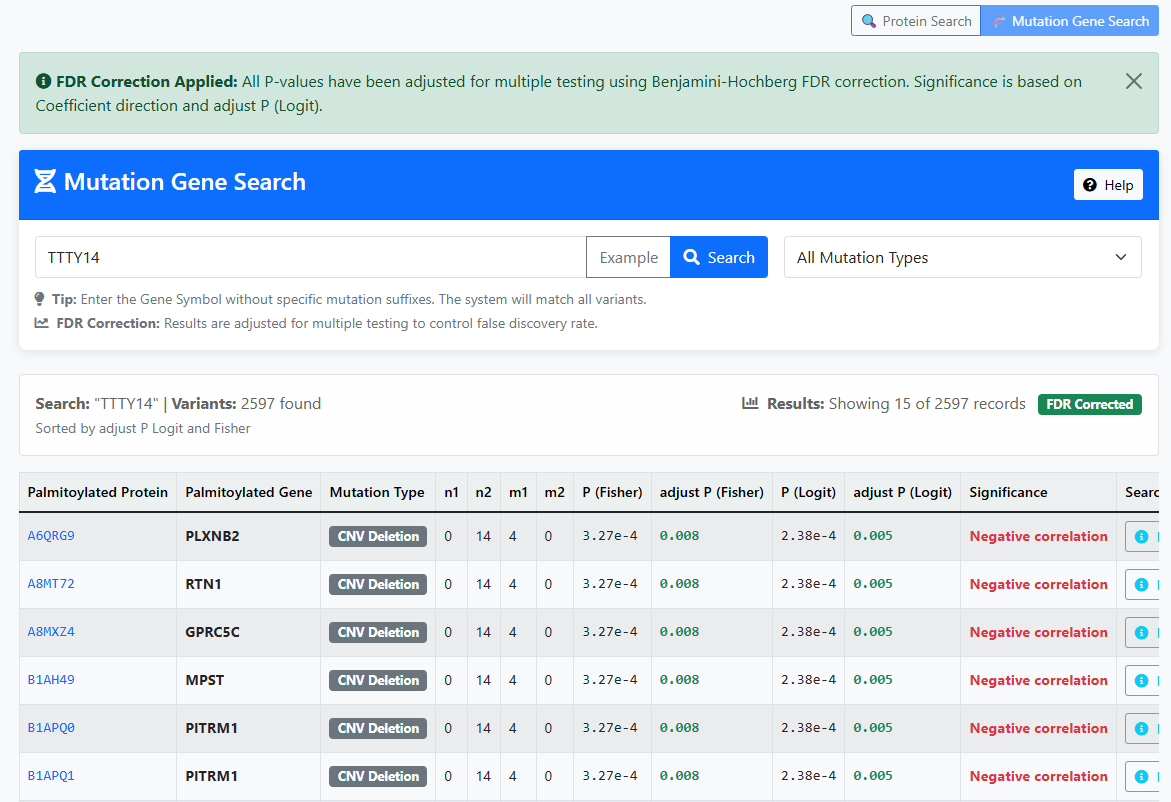
- Input: Enter Protein Accession or Gene Symbol (e.g., TTTY14)
- Function: Search all variants of a gene across different protein contexts
- Matching: Uses prefix matching (e.g., "TP53" matches "TP53_R273H", "TP53_M1863")
- Display Columns: UniProt Accession, Gene Symbol
📊 Mutation Types
CNV Amplification
- Definition: Copy number variation - gene amplification
- Impact: May lead to gene overexpression
- Significance: Associated with oncogene activation
CNV Deletion
- Definition: Copy number variation - gene deletion
- Impact: May lead to loss of gene function
- Significance: Associated with tumor suppressor gene inactivation
Hotspot Gene
- Definition: Genes with frequent mutations at specific positions
- Characteristics: Well-defined mutation hotspot regions
- Significance: Important markers of driver mutations
SNV
- Definition: Single nucleotide variations
- Types: Missense, nonsense, splice site mutations
- Impact: May affect protein structure and function
📈 Statistical Analysis
Statistical Methods
Fisher's Exact Test
- Purpose: Test association between mutation and palmitoylation
- Data: 2×2 contingency table counts
- Filtering: Results are filtered by adjust P (Fisher) < 0.05 and P (Logit) is available
Logit Regression
- Purpose: Model mutation probability based on palmitoylation
- Statistical Methods: Fisher's exact test and Firth logistic regression. The function for Firth logistic regression is “Mutation_status ~ Palmtoylation_status + Cell_line_backgound”
- Output: Coefficient (Coef_logit) and P-value
- Sorting: Results sorted by adjust P Logit and Fisher
FDR Correction
- Method: Benjamini-Hochberg FDR correction
- Output: adjust P (corrected P-values)
- Significance threshold: adjust P (Logit) < 0.05
- Display: Significant adjust P (Logit) shown in green
📋 Result Interpretation
Sample Count Columns
| Column | Description | Variable |
|---|---|---|
| n1 | Mutated and palmitoylated samples | mutated_palmitoylated |
| n2 | Mutated but non-palmitoylated samples | mutated_nonpalmitoylated |
| m1 | Wildtype but palmitoylated samples | wildtype_palmitoylated |
| m2 | Wildtype and non-palmitoylated samples | wildtype_nonpalmitoylated |
Statistical Columns
| Column | Description | Interpretation |
|---|---|---|
| P (Fisher) | Original Fisher's exact test P-value | Uncorrected significance level |
| adjust P (Fisher) | FDR-corrected Fisher's P-value | Multiple testing adjusted significance |
| P (Logit) | Original logistic regression P-value | Uncorrected significance level |
| adjust P (Logit) | FDR-corrected logistic regression P-value | Primary significance indicator |
Significance Interpretation
| Condition | Interpretation | Color Code |
|---|---|---|
| Coef_logit > 0 AND adjust P (Logit) < 0.05 | Palmitoylation increases mutation risk | Green |
| Coef_logit < 0 AND adjust P (Logit) < 0.05 | Palmitoylation decreases mutation risk | Red |
| adjust P (Logit) ≥ 0.05 | No significant association | Gray |
📊 Data Visualization
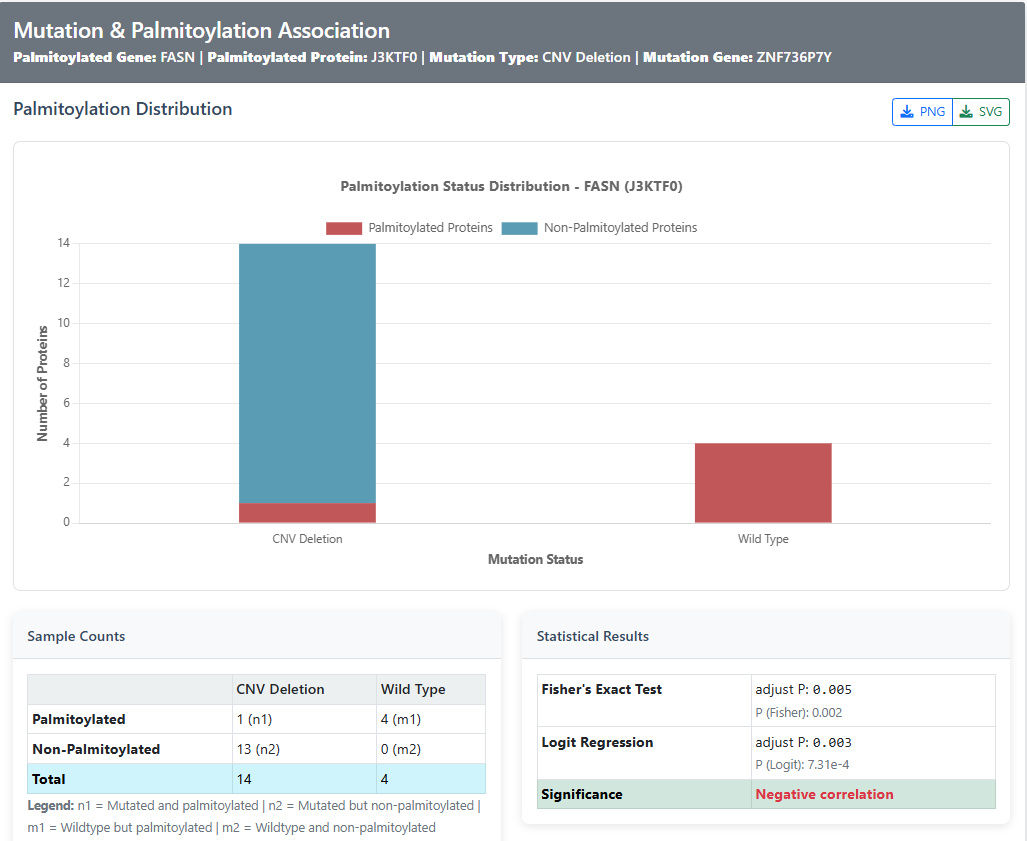
Interactive Bar Chart
- Access: Click "Chart" button in any result row
- Maroon Bars: Palmitoylated protein counts
- Blue Bars: Non-palmitoylated protein counts
- Comparison: Mutated vs wild-type samples side-by-side
- Data Labels: Exact count values displayed on bars
- Stacked Display: Clear visualization of palmitoylation status distribution
Statistical Panel
- Complete 2×2 contingency table with sample counts
- Both original P-values and FDR-corrected adjust P values
- Clear significance interpretation with color coding
- Regression coefficient with direction indication
- FDR correction status indicator
⚡ Performance Features
Optimization Techniques
- FDR Correction: Adjust P values are based on Benjamini-Hochberg FDR correction
- Caching: Frequently searched results cached for faster access (5-minute cache duration)
- Pagination: Large result sets efficiently paginated (15 records per page for protein search, 15 for mutation gene search)
- Smart Filtering: Results pre-filtered by by adjust P (Fisher) < 0.05 and P (Logit) is available
- Dynamic Column Display: Columns automatically shown/hidden based on search type
Search Tips
- Use base gene names for comprehensive variant searches (e.g., "TP53" instead of specific mutations)
- Filter by mutation type to focus on specific mutation categories
- Check adjust P (Logit) for reliable significance assessment (adjust P (Logit) indicates significance)
- Use the chart function for visual data exploration and better understanding of sample distributions
- Pay attention to color coding in results for quick significance assessment
Scientific Context
- Model: Analysis tests if palmitoylation affects mutation probability (Mutation ~ Palm)
- Biological Relevance: Understanding how post-translational modifications influence mutation patterns in cancer
- Clinical Significance: Identifying potential biomarkers and therapeutic targets
Tool 5: Multi-Protein Palmitoylation Pattern
Comprehensive analysis of palmitoylation detection patterns for multiple proteins across different samples, using interactive heatmaps and UMAP dimensionality reduction.
1 Input Configuration
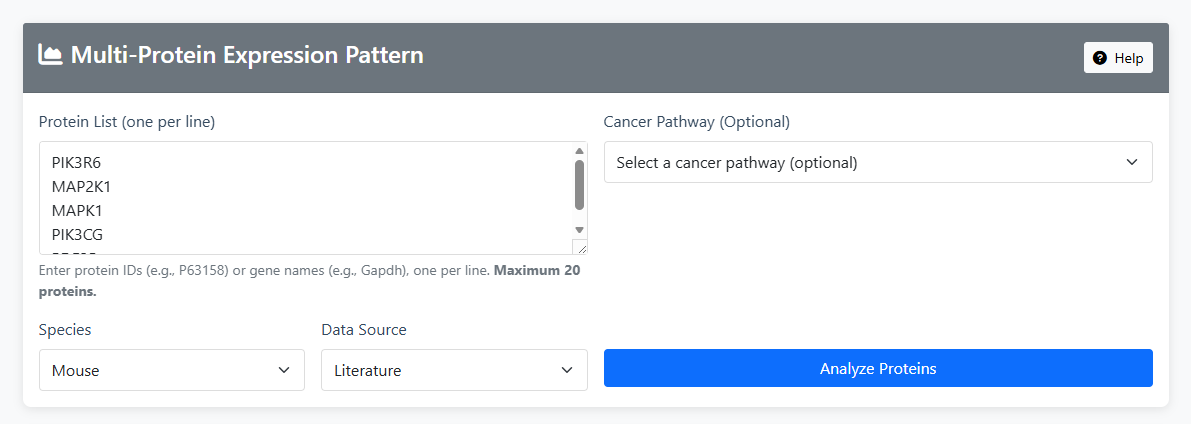
Input Methods:
- Manual Input: Paste protein IDs or gene symbols (one per line, max 20).
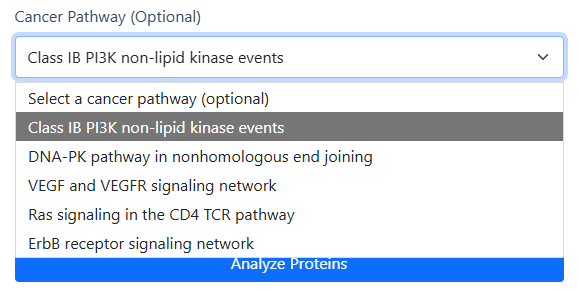
- Cancer Pathway Selection: Choose a predefined cancer signaling pathway (optional).
Species: Human or Mouse
Data Source: Literature or Mass Spectrometry
Available Cancer Pathways
- Class IB PI3K non-lipid kinase events
- DNA-PK pathway in nonhomologous end joining
- VEGF and VEGFR signaling network
- Ras signaling in the CD4 TCR pathway
- ErbB receptor signaling network
2 Analysis Execution
Click "Analyze Proteins" to generate heatmap and UMAP visualizations.
3 Results Interpretation
Analysis Summary
- Shows successfully found proteins, missing ones, and total analyzed.

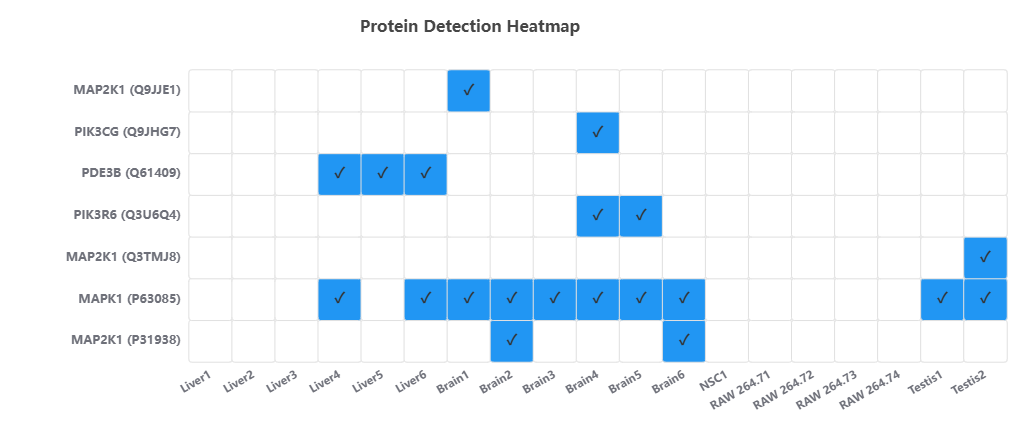
Heatmap Visualization
- Color‑coded detection matrix: White = not detected (0), Blue = detected (1).
- Automatically adjusts height/width based on data size.
- X‑axis sample labels colored by tissue/cell type.
- Identify sample clusters (vertical patterns) and protein co‑detection (horizontal patterns).
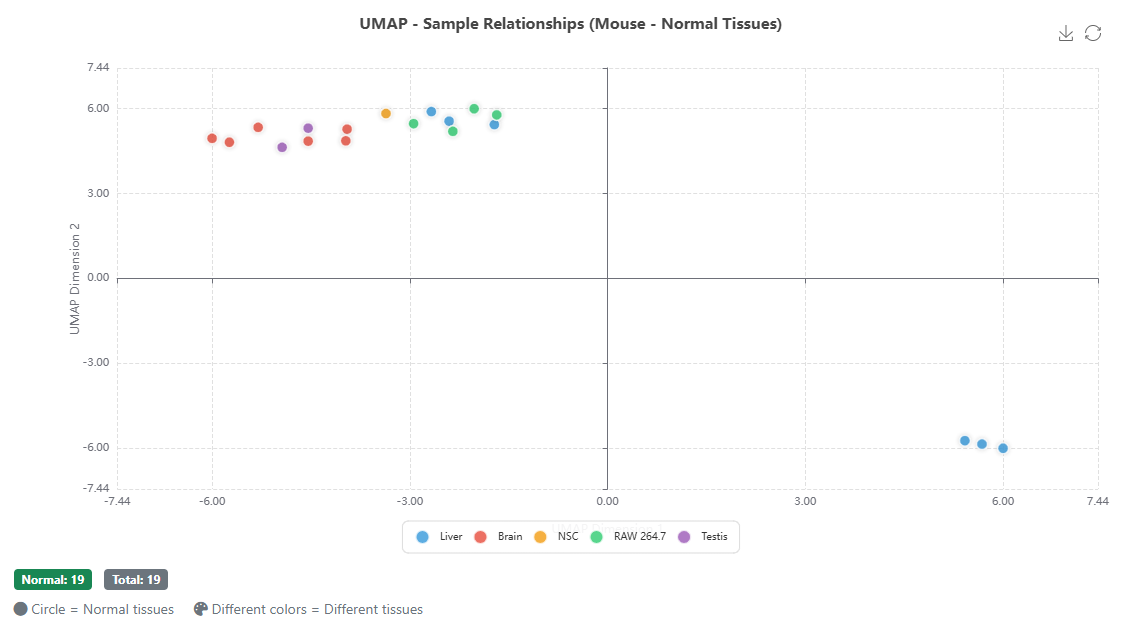
UMAP Visualization
- 2D projection of samples based on binary detection profiles.
- Points colored by tissue type; shapes indicate tumor/normal (human literature only).
- Close clusters = similar detection patterns; distant points = distinct profiles.
4 Interpretation Guide
Heatmap Patterns
- Vertical stripes: Samples with similar detection profiles.
- Horizontal stripes: Proteins with similar detection across samples.
- Block patterns: Groups of proteins co‑detected in specific sample groups.
UMAP Patterns
- Tight clusters: Highly similar detection patterns.
- Separated groups: Distinct sample types or conditions.
- Outliers: Samples with unique profiles.
Tool 6: Palmitoylation Motif Analyzer
Discover sequence motifs around palmitoylation sites and generate probability-based sequence logos using MEME.
1 Input Configuration
Step 1.1 - Select Species: Choose between Human (Homo sapiens) or Mouse (Mus musculus).
Step 1.2 - Enter Proteins: Input UniProt accessions or gene symbols (max 2000). Supports spaces, commas, tabs, or new lines as separators. Click "Example" to load sample proteins or "Clear" to reset the input field.
Step 1.3 - Select Data Sources: Choose from the following options:
- Experimental - Includes two sub-options:
- Literature: Sites from published literature
- Mass Spectrometry: MS-identified sites
- Database - Curated sites from SwissPalm, CysModDB, DBPTM, and PTMD
- GPS-Palm Prediction - Predicted sites with confidence levels (High/Medium/Low)
- Deep-Palm Prediction - Deep learning predictions (score > 0.88)

2 Set Analysis Parameters
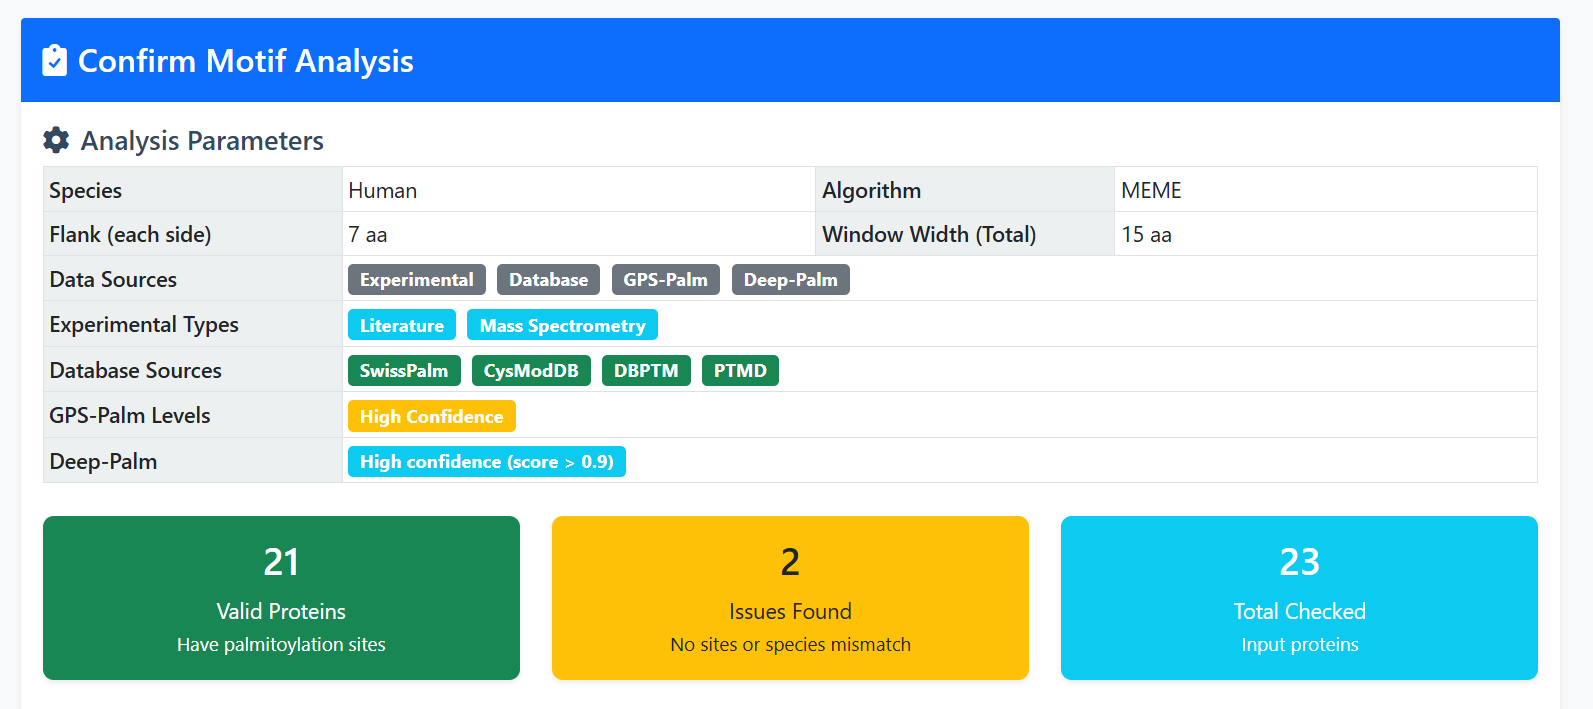
Step 2.1 - Set Flank Size: Enter the number of amino acids to extract on each side of the palmitoylation site (1-25, default: 7). Total window width is automatically calculated as Flank × 2 + 1 and displayed in the "Total Width" field (maximum 51 aa).
Step 2.2 - Submit: Click "Check Proteins & Continue" to validate your inputs and proceed.
3 Validate & Select Proteins
Step 3.1 - Review Validation Results: The confirmation page displays three summary cards:
- Valid Proteins - Proteins with palmitoylation sites ready for analysis
- Issues Found - Problems such as species mismatch or no sites found
- Total Checked - Number of input proteins processed
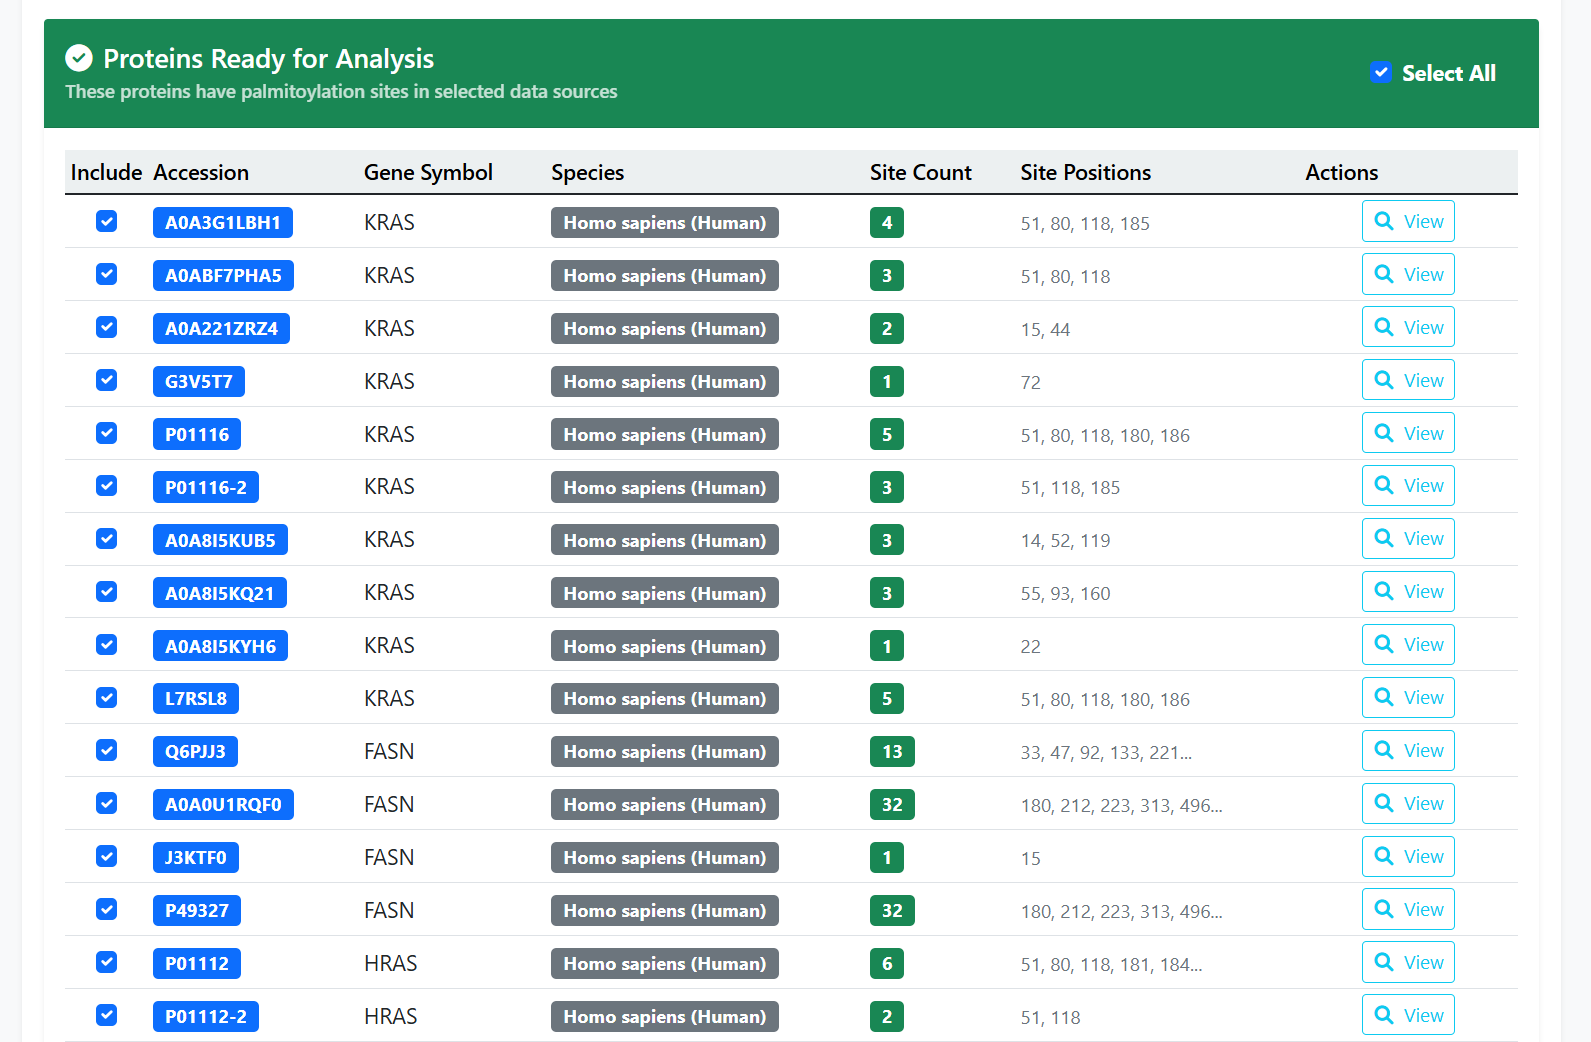
Step 3.2 - Select Proteins: Check/uncheck proteins to include in the analysis. Use "Select All" to quickly select all valid proteins. The selection count updates dynamically.
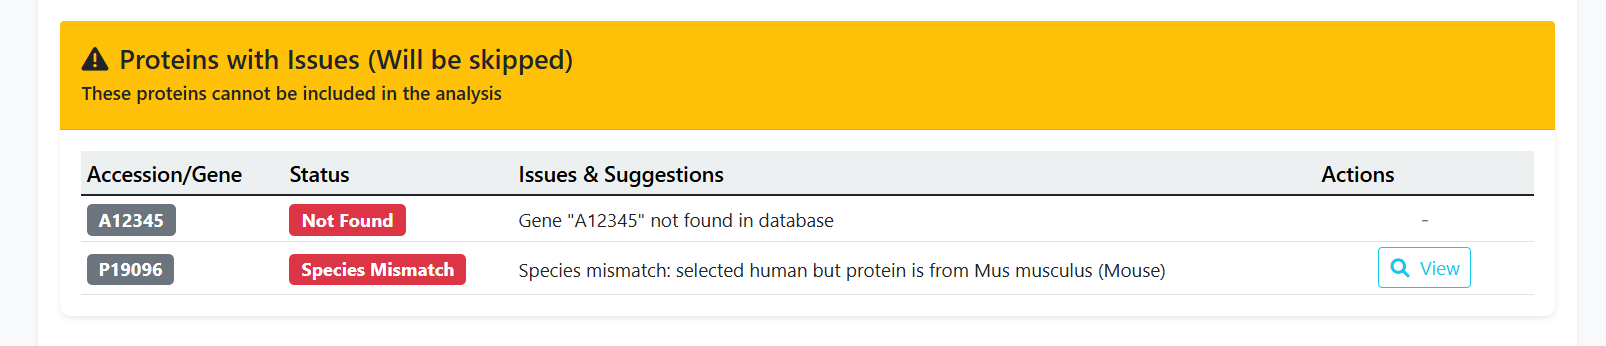
Step 3.3 - Review Issues: Proteins that cannot be analyzed are listed with specific reasons (e.g., not found, species mismatch, no sites). Each issue includes helpful suggestions.
4 Run Motif Analysis
Step 4.1 - Verify Parameters: On the confirmation page, review all selected proteins and analysis parameters.
Step 4.2 - Click "Run Motif Analysis": The tool will extract sequences, run MEME, and generate sequence logos.
Step 4.3 - Loading Screen: A semi-transparent overlay appears with a spinning loader indicating analysis in progress.
5 Interpret Results
Step 5.1 - Review Summary: The results page displays four summary cards:
- Proteins Analyzed - Number of proteins successfully processed
- Total Sites - Number of palmitoylation sites extracted
- Motifs Found - Number of significant motifs discovered by MEME (up to 5)
- Total Width - Motif length in amino acids (Flank × 2 + 1)
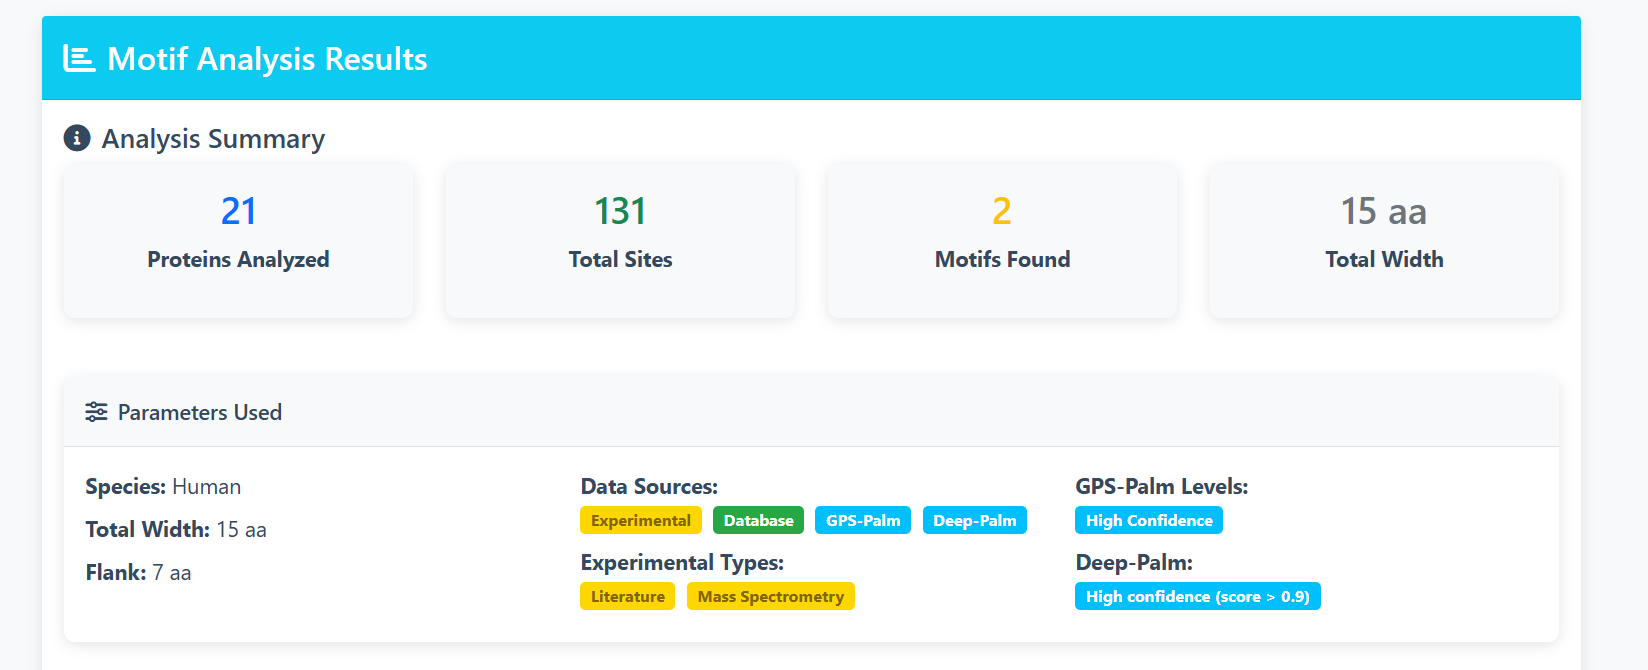
Step 5.2 - Browse Analyzed Proteins: A paginated table (10 proteins per page) shows each protein's accession, gene symbol, site count, and positions. The pagination control includes:
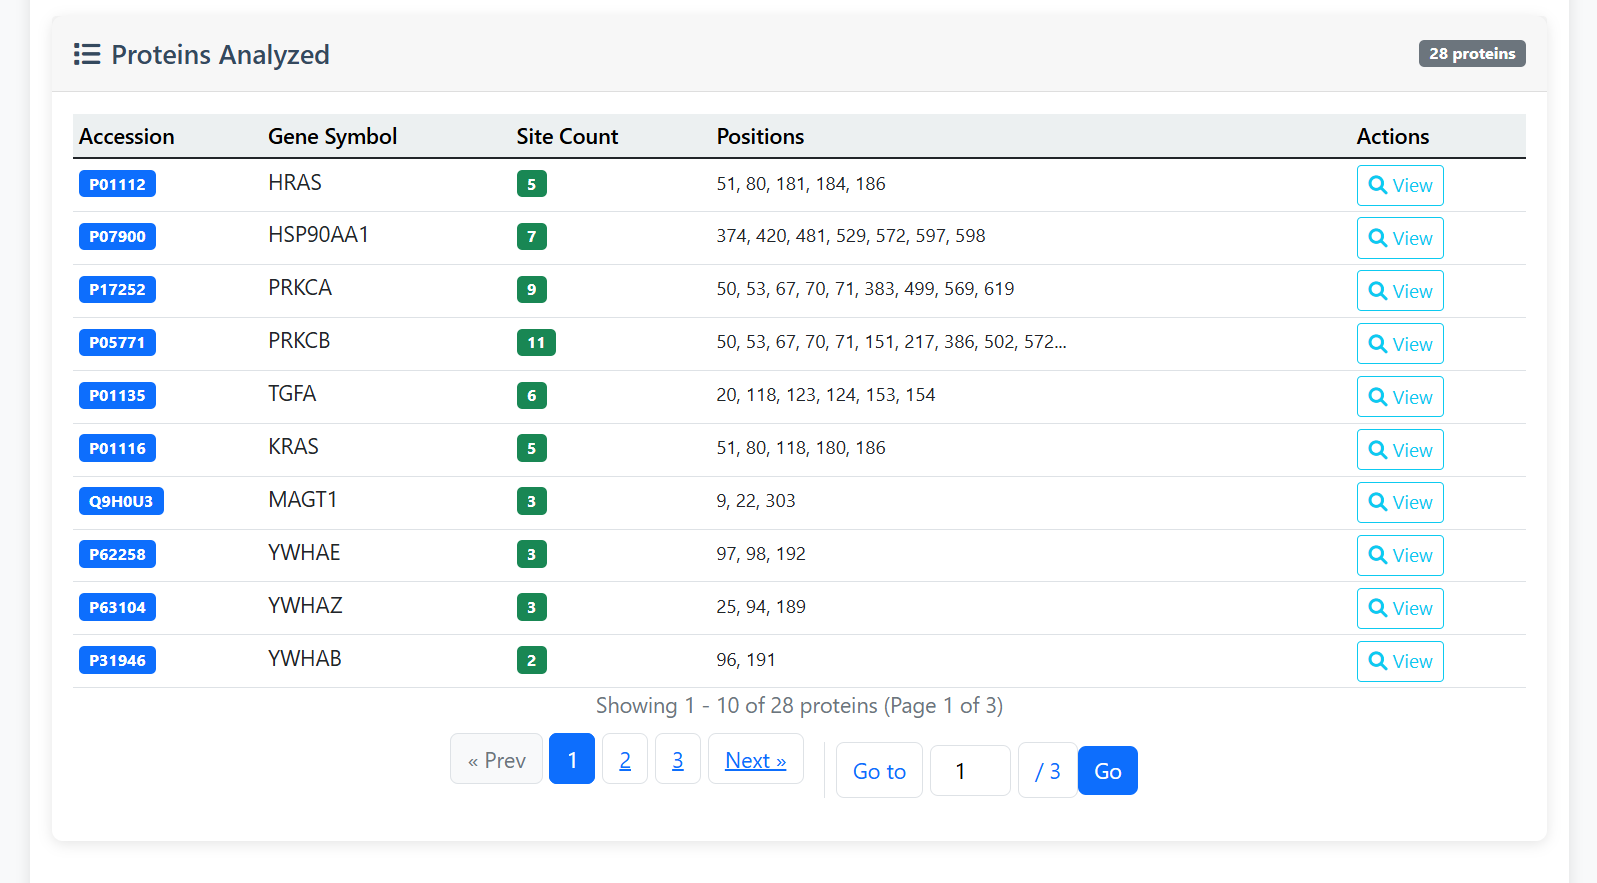
Step 5.3 - Parameters Used: A detailed parameter panel shows:
- Selected species (Human/Mouse)
- Window width and flank size
- Data sources selected (Experimental, Database, GPS-Palm, Deep-Palm)
- Experimental types (Literature, Mass Spectrometry)
- GPS-Palm confidence levels (High/Medium/Low)
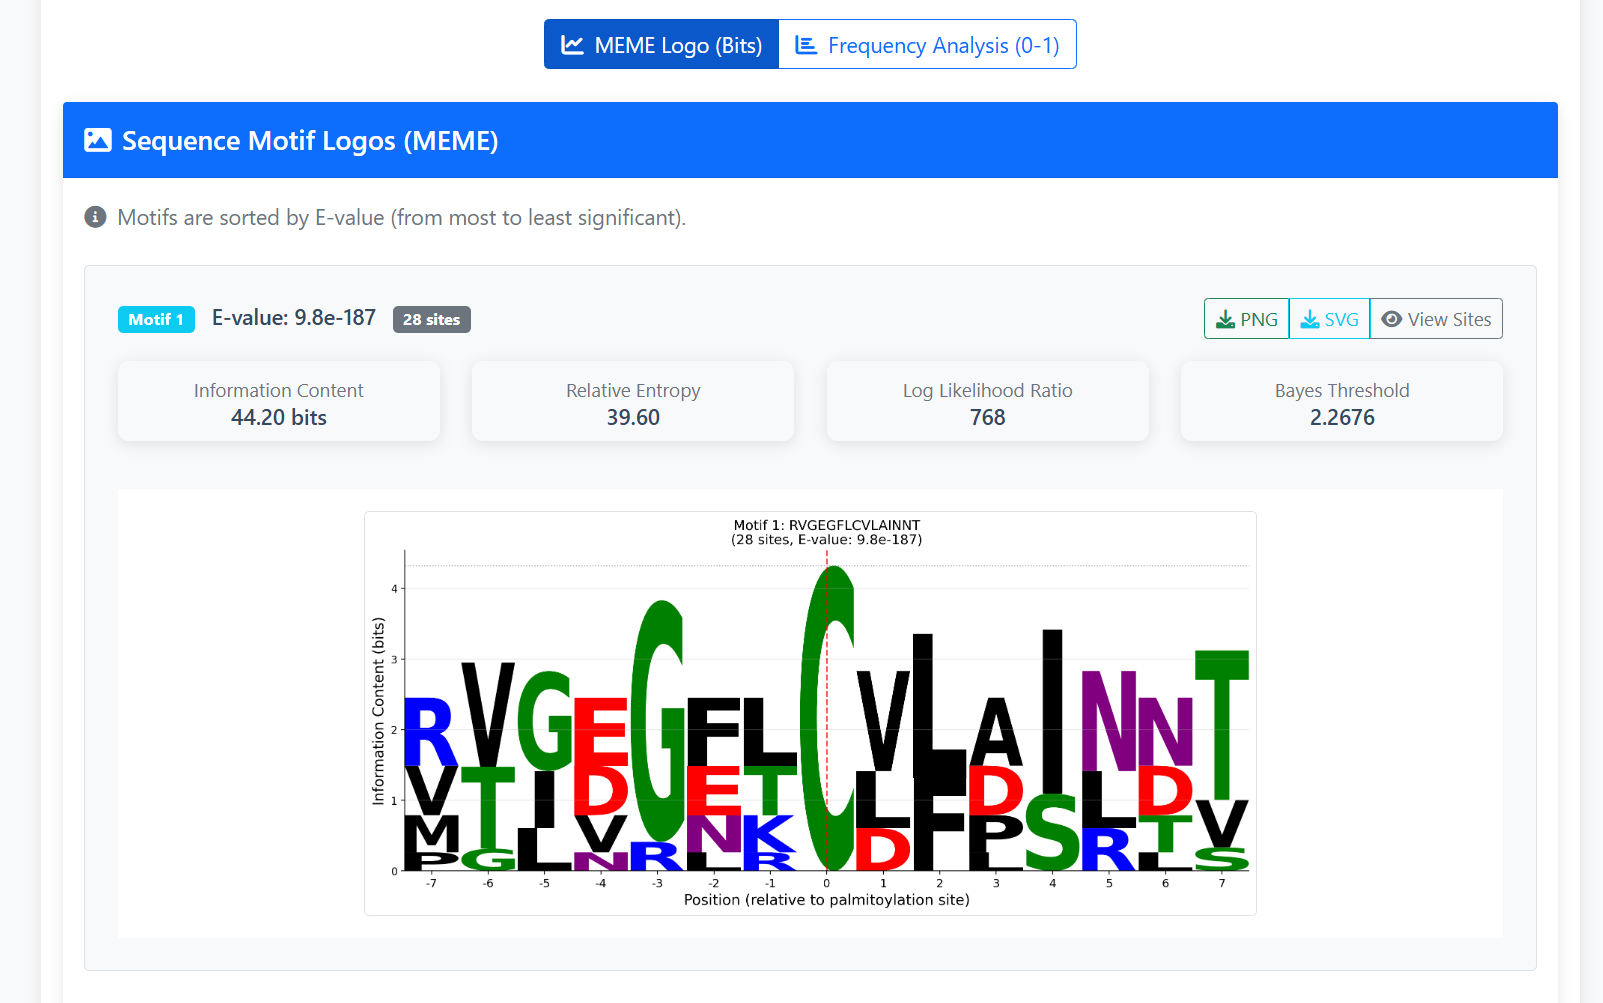
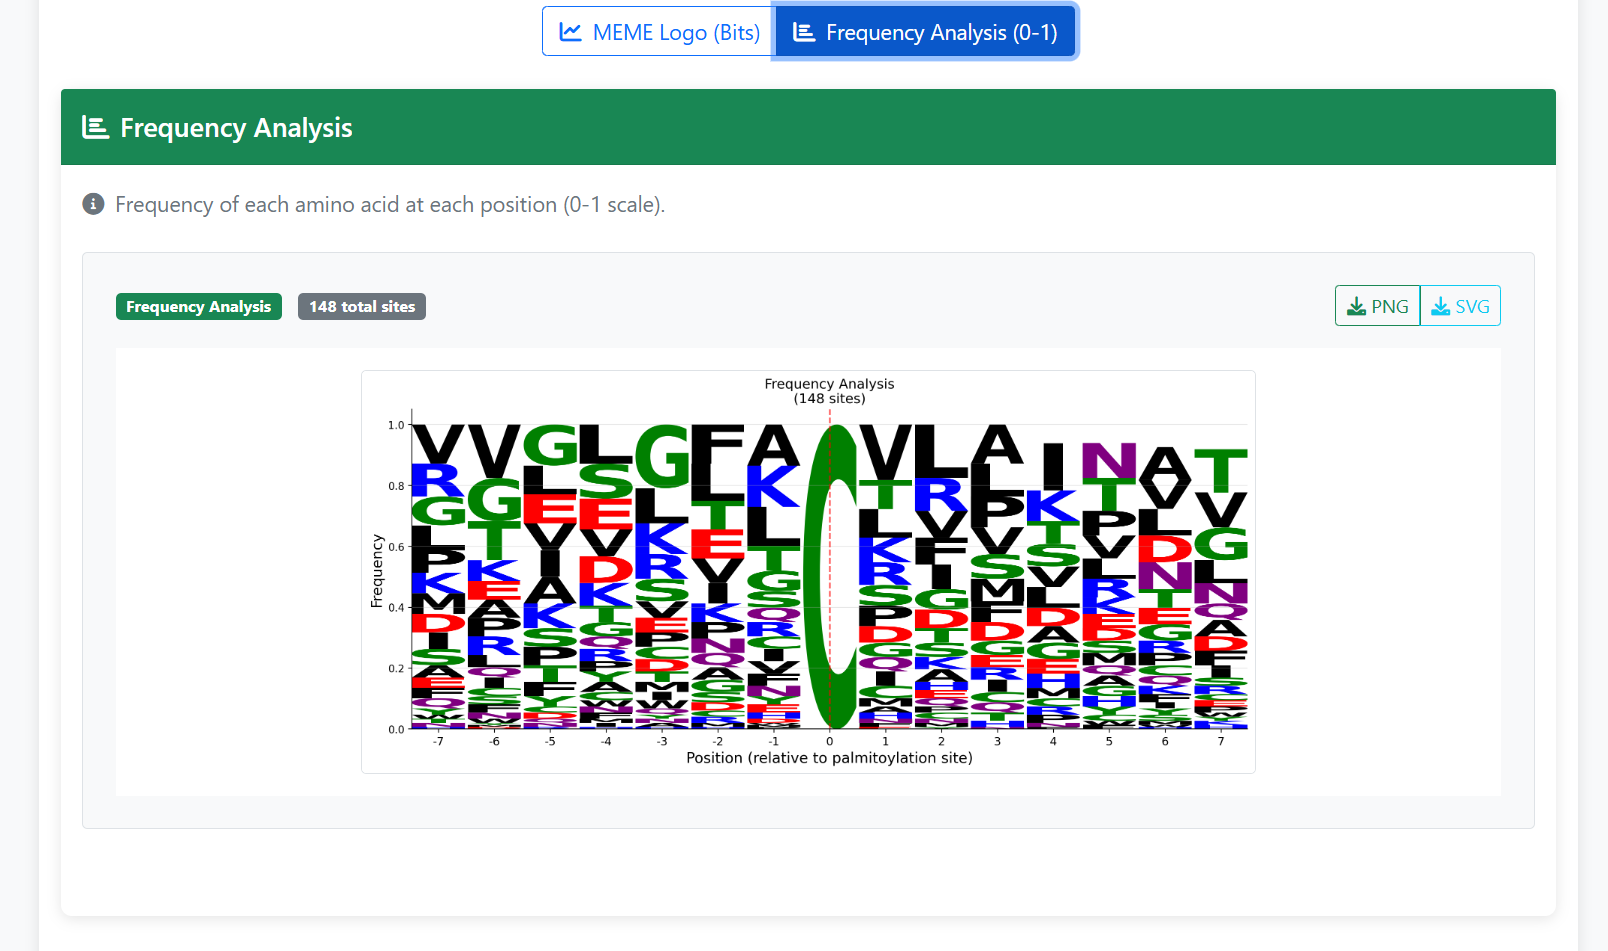
Step 5.4 - View Mode Toggle: Two visualization modes are available:
- MEME Logo (Bits) - Information content in bits .
- Frequency Analysis (0-1) - Simple frequency of each amino acid (0-1 scale).
Step 5.5 - Examine Each Motif: For each discovered motif, you will see:
- Motif Number and E-value - Statistical significance (lower = more significant)
- Site Count - Number of sequences containing this motif
- Statistical Metrics:
- Information Content (bits) - Total information at each position
- Relative Entropy - Measure of sequence conservation
- Log Likelihood Ratio - Likelihood of motif vs background
- Bayes Threshold - Bayesian significance threshold
- Regular Expression - Pattern representation of the motif
- Sequence Logo - Letter height represents information content; amino acids colored by chemical properties
Step 5.6 - Download Logos: Each motif has download options:
- PNG - Download the motif logo as a high-resolution PNG image
- SVG - Download as SVG vector format (ideal for publications and further editing)
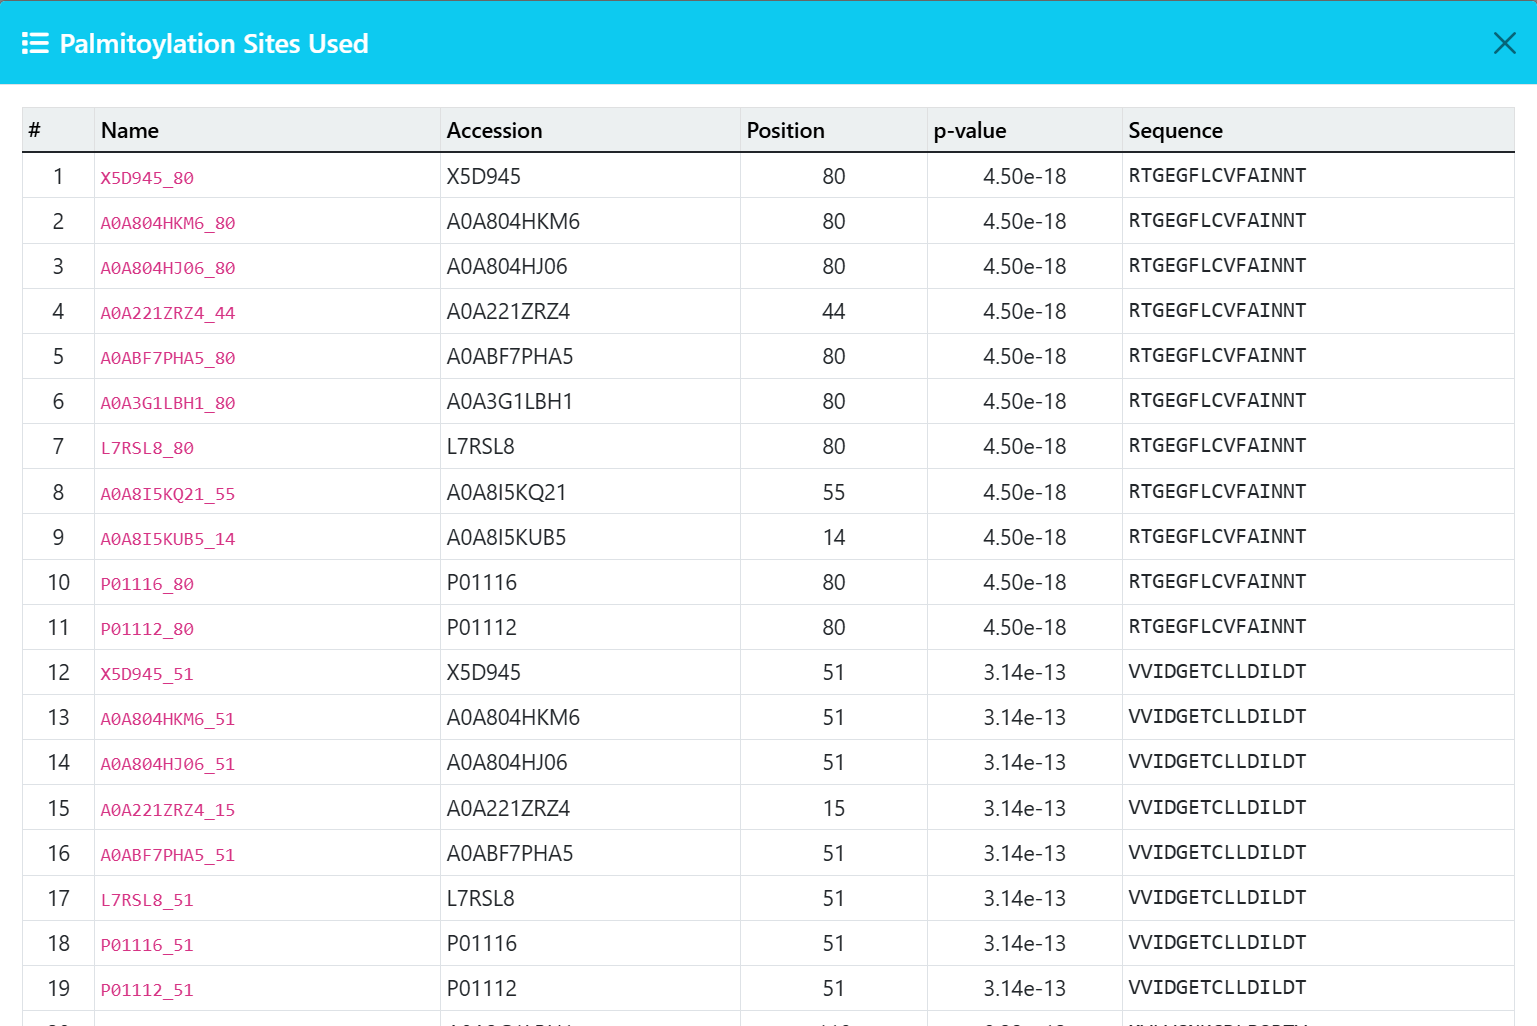
Step 5.7 - View Sites: Click "View Sites" to see a detailed table of all palmitoylation sequences used for that motif, including:
- Sequence name and accession number
- Palmitoylation site position
- p-value for the site
- Color-coded amino acid sequence
Step 5.8 - Image Enlargement: Click on any sequence logo to view it in full size in a modal overlay.
Step 5.9 - Start New Analysis: Click "New Analysis" to return to the configuration page and start a fresh analysis.
Citing
- [1] Morrison,E., Kuropka,B., Kliche,S., Brügger,B., Krause,E. and Freund,C. (2015) Quantitative analysis of the human T cell palmitome. Sci. Rep., 5, 11598.
- [2] Zingler,P., Särchen,V., Glatter,T., Caning,L., Saggau,C., Kathayat,R.S., Dickinson,B.C., Adam,D., Schneider-Brachert,W., Schütze,S., et al. (2019) Palmitoylation is required for TNF-R1 signaling. Cell Commun. Signal.: CCS, 17, 90.
- [3] Forrester,M.T., Egol,J.R., Tata,A., Tata,P.R. and Foster,M.W. (2024) Analysis of Protein Cysteine Acylation Using a Modified Suspension Trap (Acyl-Trap). J. Proteome Res., 23, 3716–3725.
- [4] Collins,M.O., Woodley,K.T. and Choudhary,J.S. (2017) Global, site-specific analysis of neuronal protein S-acylation. Sci. Rep., 7, 4683.
- [5] Colquhoun,D.R., Lyashkov,A.E., Ubaida Mohien,C., Aquino,V.N., Bullock,B.T., Dinglasan,R.R., Agnew,B.J. and Graham,D.R.M. (2015) Bioorthogonal mimetics of palmitoyl-CoA and myristoyl-CoA and their subsequent isolation by click chemistry and characterization by mass spectrometry reveal novel acylated host-proteins modified by HIV-1 infection. Proteomics, 15, 2066–2077.
- [6] Marin,E.P., Derakhshan,B., Lam,T.T., Davalos,A. and Sessa,W.C. (2012) Endothelial cell palmitoylproteomic identifies novel lipid-modified targets and potential substrates for protein acyl transferases. Circ. Res., 110, 1336–1344.
- [7] Won,S.J. and Martin,B.R. (2018) Temporal profiling establishes a dynamic S-palmitoylation cycle. ACS Chem. Biol., 13, 1560–1568.
- [8] Yang,W., Di Vizio,D., Kirchner,M., Steen,H. and Freeman,M.R. (2010) Proteome scale characterization of human S-acylated proteins in lipid raft-enriched and non-raft membranes. Mol. Cell. Proteom.: MCP, 9, 54–70.
- [9] Gould,N.S., Evans,P., Martínez-Acedo,P., Marino,S.M., Gladyshev,V.N., Carroll,K.S. and Ischiropoulos,H. (2015) Site-specific proteomic mapping identifies selectively modified regulatory cysteine residues in functionally distinct protein networks. Chem. Biol., 22, 965–975.
- [10] Ji,G., Wu,R., Zhang,L., Yao,J., Zhang,C., Zhang,X., Liu,Z., Liu,Y., Wang,T., Fang,C., et al. (2023) Global analysis of endogenously intact S-acylated peptides reveals localization differentiation of heterogeneous lipid chains in mammalian cells. Anal. Chem., 95, 13055–13063.
- [11] Fang,C., Zhang,X., Zhang,L., Gao,X., Yang,P. and Lu,H. (2016) Identification of palmitoylated transitional endoplasmic reticulum ATPase by proteomic technique and pan antipalmitoylation antibody. J. Proteome Res., 15, 956–962.
- [12] Pinner,A.L., Tucholski,J., Haroutunian,V., McCullumsmith,R.E. and Meador-Woodruff,J.H. (2016) Decreased protein S-palmitoylation in dorsolateral prefrontal cortex in schizophrenia. Schizophr. Res., 177, 78–87.
- [13] Wei,X., Song,H. and Semenkovich,C.F. (2014) Insulin-regulated protein palmitoylation impacts endothelial cell function. Arterioscler., Thromb., Vasc. Biol., 34, 346–354.
- [14] Wilson,J.P., Raghavan,A.S., Yang,Y.-Y., Charron,G. and Hang,H.C. (2011) Proteomic analysis of fatty-acylated proteins in mammalian cells with chemical reporters reveals S-acylation of histone H3 variants. Mol. Cell. Proteom.: MCP, 10, M110.001198.
- [15] Martin,B.R. and Cravatt,B.F. (2009) Large-scale profiling of protein palmitoylation in mammalian cells. Nat. Methods, 6, 135–138.
- [16] Thinon,E., Fernandez,J.P., Molina,H. and Hang,H.C. (2018) Selective enrichment and direct analysis of protein S-palmitoylation sites. J. Proteome Res., 17, 1907–1922.
- [17] Zhou,B., Wang,Y., Yan,Y., Mariscal,J., Di Vizio,D., Freeman,M.R. and Yang,W. (2019) Low-Background Acyl-Biotinyl Exchange Largely Eliminates the Coisolation of Non-S-Acylated Proteins and Enables Deep S-Acylproteomic Analysis. Anal Chem, 91, 9858–9866.
- [18] Mariscal,J., Vagner,T., Kim,M., Zhou,B., Chin,A., Zandian,M., Freeman,M.R., You,S., Zijlstra,A., Yang,W., et al. (2020) Comprehensive palmitoyl-proteomic analysis identifies distinct protein signatures for large and small cancer-derived extracellular vesicles. J. Extracell. Vesicles, 9, 1764192.
- [19] Morrison,E., Wegner,T., Zucchetti,A.E., Álvaro-Benito,M., Zheng,A., Kliche,S., Krause,E., Brügger,B., Hivroz,C. and Freund,C. (2020) Dynamic palmitoylation events following T-cell receptor signaling. Commun. Biol., 3, 368.
- [20] Cervilla-Martínez,J.F., Rodríguez-Gotor,J.J., Wypijewski,K.J., Fontán-Lozano,Á., Wang,T., Santamaría,E., Fuller,W. and Mejías,R. (2022) Altered cortical palmitoylation induces widespread molecular disturbances in parkinson’s disease. Int. J. Mol. Sci., 23, 14018.
- [21] Miles,M.R., Seo,J., Jiang,M., Wilson,Z.T., Little,J., Hao,J., Andrade,J., Ueberheide,B. and Tseng,G.-N. (2021) Global identification of S-palmitoylated proteins and detection of palmitoylating (DHHC) enzymes in heart. J. Mol. Cell. Cardiol., 155, 1–9.
- [22] Ziemlińska,E., Sobocińska,J., Świątkowska,A., Hromada-Judycka,A., Traczyk,G., Malinowska,A., Świderska,B., Mietelska-Porowska,A., Ciesielska,A. and Kwiatkowska,K. (2021) Palm oil-rich diet affects murine liver proteome and S-palmitoylome. Int. J. Mol. Sci., 22, 13094.
- [23] Zaręba-Kozioł,M., Bartkowiak-Kaczmarek,A., Roszkowska,M., Bijata,K., Figiel,I., Halder,A.K., Kamińska,P., Müller,F.E., Basu,S., Zhang,W., et al. (2021) S-palmitoylation of synaptic proteins as a novel mechanism underlying sex-dependent differences in neuronal plasticity. Int. J. Mol. Sci., 22, 6253.
- [24] Gorenberg,E.L., Massaro Tieze,S., Yücel,B., Zhao,H.R., Chou,V., Wirak,G.S., Tomita,S., Lam,T.T. and Chandra,S.S. (2022) Identification of substrates of palmitoyl protein thioesterase 1 highlights roles of depalmitoylation in disulfide bond formation and synaptic function. PLOS Biol., 20, e3001590.
- [25] Wegleiter,T., Buthey,K., Gonzalez-Bohorquez,D., Hruzova,M., Bin Imtiaz,M.K., Abegg,A., Mebert,I., Molteni,A., Kollegger,D., Pelczar,P., et al. (2019) Palmitoylation of BMPR1a regulates neural stem cell fate. Proc. Natl. Acad. Sci. U. S. A., 116, 25688–25696.
- [26] Zareba-Koziol,M., Bartkowiak-Kaczmarek,A., Figiel,I., Krzystyniak,A., Wojtowicz,T., Bijata,M. and Wlodarczyk,J. (2019) Stress-induced changes in the S-palmitoylation and S-nitrosylation of synaptic proteins. Mol. Cell. Proteom.: MCP, 18, 1916–1938.
- [27] Shen,L.-F., Chen,Y.-J., Liu,K.-M., Haddad,A.N.S., Song,I.-W., Roan,H.-Y., Chen,L.-Y., Yen,J.J.Y., Chen,Y.-J., Wu,J.-Y., et al. (2017) Role of S-palmitoylation by ZDHHC13 in mitochondrial function and metabolism in liver. Sci. Rep., 7, 2182.
- [28] Speck,S.L., Bhatt,D.P., Zhang,Q., Adak,S., Yin,L., Dong,G., Feng,C., Zhang,W., Ben Major,M., Wei,X., et al. (2023) Hepatic palmitoyl-proteomes and acyl-protein thioesterase protein proximity networks link lipid modification and mitochondria. Cell Rep., 42, 113389.
- [29] Gao,J., Li,W., Zhang,Z., Gao,W. and Kong,E. (2022) Proteome-wide identification of palmitoylated proteins in mouse testis. Reprod. Sci., 29, 2299–2309.
- [30] Zhang,X., Zhang,Y., Fang,C., Zhang,L., Yang,P., Wang,C. and Lu,H. (2018) Ultradeep palmitoylomics enabled by dithiodipyridine-functionalized magnetic nanoparticles. Anal. Chem., 90, 6161–6168.
- [31] Sobocińska,J., Roszczenko-Jasińska,P., Zaręba-Kozioł,M., Hromada-Judycka,A., Matveichuk,O.V., Traczyk,G., Łukasiuk,K. and Kwiatkowska,K. (2018) Lipopolysaccharide upregulates palmitoylated enzymes of the phosphatidylinositol cycle: an insight from proteomic studies. Mol. Cell. Proteom.: MCP, 17, 233–254.